


Being listed in checkout is not the same as being chosen.
Across millions of webshops, delivery providers are technically present at checkout, but the way they are presented varies widely. Sometimes the carrier is not named at all due to white-label setups. Sometimes delivery methods are bundled or implicit. Often, delivery time is missing.
When that happens, consumers hesitate or default to another option. And as agentic e-commerce will partly move checkout decisions towards automation and agent-driven flows, delivery options that are not clearly defined are even more likely to be skipped.
This is the problem the Checkout score is built to address.

Checkout setups are qualitative by nature. For years, Tembi has monitored how delivery providers are presented in checkout across large numbers of webshops.
With the Checkout score, this insight is now summarised per webshop, making it easy for carriers to identify where their service is not clearly surfaced and what is missing. The result is a simple, comparable overview of checkout visibility across all monitored webshops.
The Checkout score is built from observable elements in the checkout flow. Each webshop is assessed on whether key delivery information is explicitly presented to the shopper.
By default, the score covers three core parameters:
Each webshop receives a simple score (for example 1/3 or 2/3) along with a qualitative label (low, medium, high), making it easy to interpret at a glance.
The aim is not to define a perfect checkout, but to enable consistent comparison across clients, markets, and competitors.

The Checkout score is designed to support commercial and strategic teams by making checkout presentation visible, comparable, and trackable.
Key Account Management
Leadership
Checkout setups change frequently. Delivery options are added, renamed, re-sorted, or removed.
What previously required manual review across individual webshops can now be monitored systematically and at scale.
The Checkout score is calculated continuously and shown alongside historical data, allowing teams to:
This turns checkout from a static snapshot into an operational signal.

Not all last-mile providers care about the same things.
The Checkout score is configurable, allowing teams to decide which elements should be included based on their commercial focus. In addition to the default parameters, optional elements such as environment-friendly delivery can be enabled where sustainability positioning or green sorting plays a commercial role.
When additional parameters are enabled, the score adapts automatically – for example moving from a 3-point to a 4-point model.
As checkout decisions increasingly become automated, delivery information needs to be machine-readable as well as understandable to humans.
If a delivery option is present but poorly defined – missing a named provider, a clear method, or delivery timing – it becomes harder for both consumers and agents to select it.
The Checkout score makes delivery presentation explicit, structured, and measurable across all monitored webshops.
And once it is measurable, it becomes something teams can actively improve – rather than guess at.
Spain counts 89,038 active online retailers, with clothes & shoes leading the category mix, an estimated +1,2bn parcels/year, and average delivery prices at €4,9 (home) vs €4,4 (OOH) for lightweight items. Our new Spain report maps the market structure, checkout dynamics, delivery methods, and how the main carriers compete for visibility - including the often-overlooked impact of white-label checkouts.
If you’re working in last-mile delivery and want a competitive view of Spain, download the full report here.
This report focuses on nine of the largest delivery providers in Spain: Correos / Correos Express, MRW, GLS, SEUR/DPD/Tipsa, DHL, NACEX, FedEx/TNT, CTT, and InPost/Mondial Relay. End-to-end retail & logistics operators (e.g., Amazon) and smaller/specialised operators (refrigerated, oversized, etc.) are intentionally excluded to keep the comparison clean and actionable.
All figures are based on Tembi’s continuous monitoring and analysis of Spanish online retailers and checkout setups, with consistent classification to support like-for-like analysis across markets. Use it to maintain competitive advantage, capture share in attractive segments, and understand market dynamics with clarity.
Quick takeaways
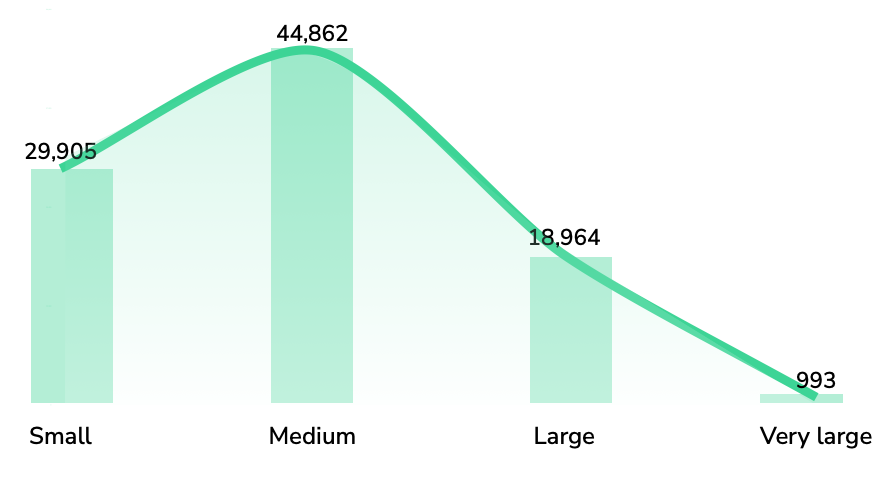
Spain is home to nearly 90,000 active online retailers, with a long tail that still produces meaningful parcel demand - and a smaller set of large/very large retailers that set service expectations (speed, returns, OOH availability, and delivery choice). Category-wise, Spain’s retailer base is led by clothes and shoes (~12,19%), followed by health & medicine (~7,04%) and beauty & personal care (~6,3%).

In Spain, share of presence (where a provider appears as an option in checkout) is heavily led by Correos / Correos Express, which shows up across ~41% of branded checkouts in our dataset, far ahead of the next tier (MRW, GLS, SEUR/DPD/Tipsa).
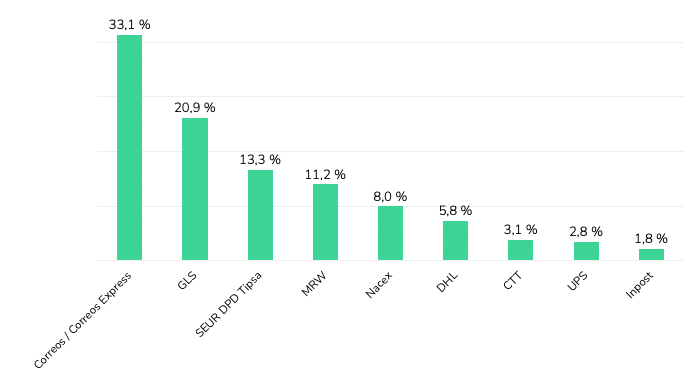
But presence is only half the story. In checkout, position matters.
Across Spanish webshops where delivery provider brands are visible, Correos / Correos Express holds the first position most frequently (33,1%), followed by GLS (20,9%) and SEUR / DPD / Tipsa (13,3%). MRW (11,2%) and NACEX (8,0%) follow, with DHL (5,8%) and smaller shares for others.
If you read our Italy last-mile delivery analysis, you’ll recognise the same core idea: the checkout is the battlefield. The winners aren’t only those with the biggest networks - they’re the providers most consistently prioritised where consumers actually make the choice - why checkout position and visibility are a key differentiators in revenue and brand building.
Here is the uncomfortable truth for last-mile brands: a large share of Spanish retailers don’t show carrier names at all - they show only delivery methods and prices.
This matters because it means “market share” can look very different depending on whether you measure parcel volumes, merchant relationships, or brand visibility to consumers. For carriers, improving brand exposure inside white-label environments is one of the largest untapped levers in Spain - because it’s not a network problem, it’s a checkout/integration problem.

Across the market, home delivery is still the default, and the regulator view aligns with what we see in retailer setups: CNMC reports that in 2024 the usual delivery place was home (68,9%), with PUDO/convenience points (13,6%) and lockers (3,8%).
When we look at delivery methods displayed across retailers (excluding white-label checkouts), the same story holds: OOH is present, but underbuilt - especially compared to where Spain could go given consumer density and the cost-to-serve logic that OOH enables.
And pricing reinforces the direction of travel: for lightweight items, average delivery prices are roughly €4,9 (home) vs €4,3–€4,5 (OOH) depending on parcel shop vs locker. Spain is also cheaper than Italy across all options, which changes the “room” carriers have to subsidise adoption - but not the underlying incentive to densify OOH.

While retailers set the price shown in checkout, these figures consistently reflect provider positioning.

Not all “presence” is equal. The value of a provider’s retailer base depends on who those retailers are.
Using Tembi’s size scoring (0–100), we can see clear portfolio skews:

Category exposure shows the same idea from a different angle: providers aren’t just “generalists” - each ends up with a distinct category footprint (e.g., stronger concentration in health & medicine, fashion, electronics, etc.)
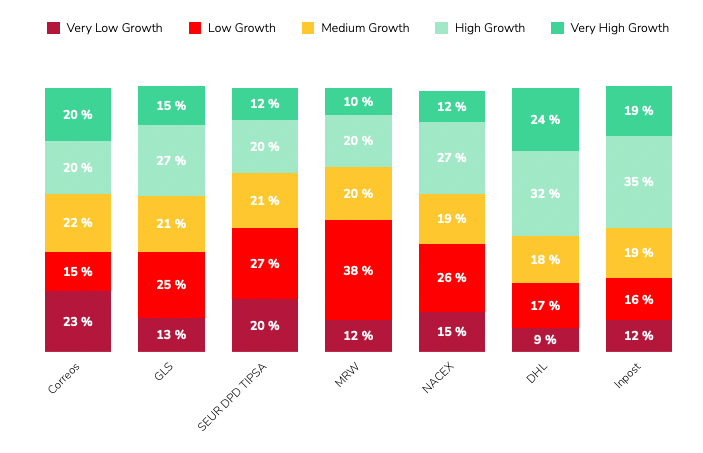
Finally, our Growth Indicator model adds a forward-looking layer: DHL and InPost have the strongest growth-weighted portfolios, with 56% and 54% of their clients forecast to be in high or very high growth bands. Correos shows a more balanced mix across growth bands.
If you want the practical “so what” for Spain, three things stand out:
Spain’s last-mile market is large, competitive, and still structurally under-optimised in checkout. Correos dominates branded presence and first-position frequency, white-label checkouts hide a big part of the market, and OOH remains a clear runway - with meaningful differences in portfolio quality and growth potential across providers.
Download the full Spain report, or schedule a Tembi demo to see your competitive landscape updated continuously across markets - including comparisons to our Italy analysis
Italy counts 94,724 online retailers, with clothing, groceries and beauty leading the mix, average home delivery cost at €6.5 and OOH at €5.8. With continued investment and InPost’s strong market entry, OOH delivery is expanding rapidly and reshaping the competitive landscape. This Italian last-mile delivery market analysis maps the structure, methods and provider portfolios behind the numbers.
Working in last-mile delivery and interested in another competitive market analysis beyond Italy? Let's connect. Download the full report here.
Italy remains one of Europe’s most active e-commerce markets by merchant count and parcel flow. To help last-mile executives benchmark strategy, this report profiles the market composition, delivery method availability and pricing, and the competitive landscape across six core providers: GLS, Poste Italiane, DPD BRT, DHL, InPost, and FedEx (TNT). You’ll see where demand concentrates by category, how pricing positions each method, and how provider client portfolios skew by retailer size and expected growth.
All figures are derived from Tembi’s continuous monitoring and analysis of Italian online retailers and checkout setups, with consistent taxonomy and normalisation to support like-for-like comparisons. Use it to maintain competitive advantage, capture share in attractive segments, and understand market dynamics with clarity.
Quick takeaways
Italy’s 94,724-strong retailer base skews to clothes & shoes (≈12.1%), then food & groceries (≈6.7%), and beauty (≈5.4%). The size pyramid shows most merchants are medium, fewer large, and about 1% very large, indicating a wide long-tail with concentrated head accounts that influence parcel mix and service expectations. The latest available data from 2020 suggest that around 830 million parcels are shipped domestically each year. Given the latest e-commerce growth estimation of an average annual growth rate of 4.5%, parcel volumes could now be approaching one billion shipments.
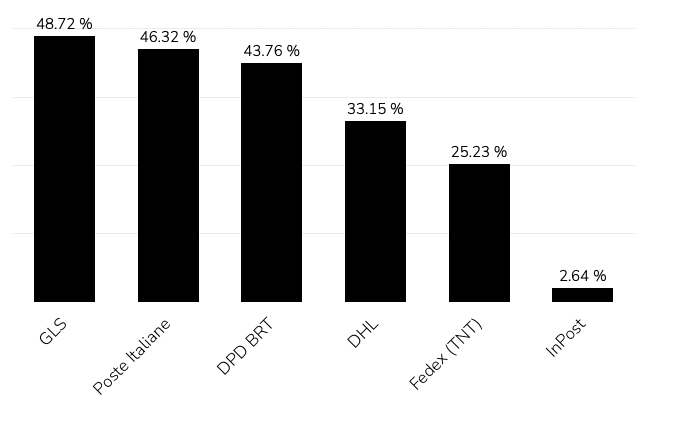
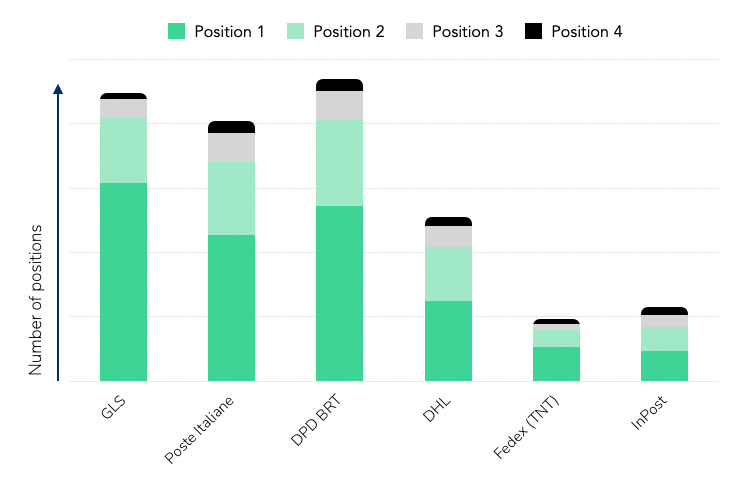
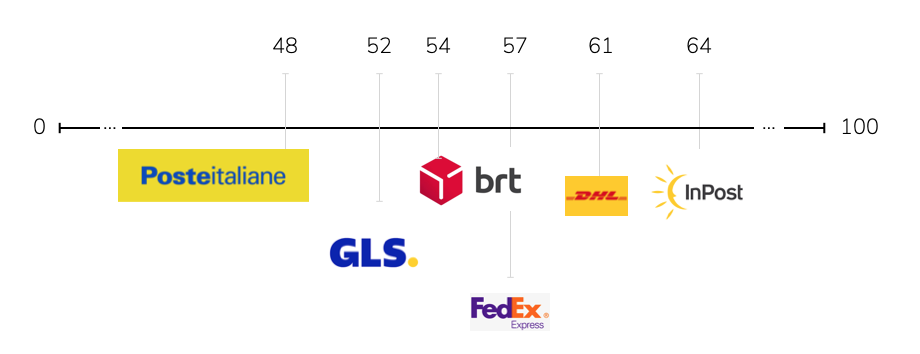
GLS and Poste Italiane hold the broadest presence across Italian webshops - GLS appears in 48.7% of retailer checkouts and Poste Italiane in 46.3%. DPD BRT, DHL, InPost, and FedEx (TNT) follow, forming the rest of the competitive landscape.
When looking at the first delivery option offered to shoppers, GLS leads with roughly 30%, followed by DPD BRT (26%) and Poste Italiane (22%).This ordering pattern reflects how retailers prioritise providers based on network reach, reliability, and negotiated terms rather than pure visibility.

In short:
Across Italian retailers, home delivery remains dominant, offered by roughly 89% of webshops. Parcel shops (≈9%) and parcel lockers (≈3%) are still at an early stage of rollout, but both formats are expanding as networks and integrations mature.
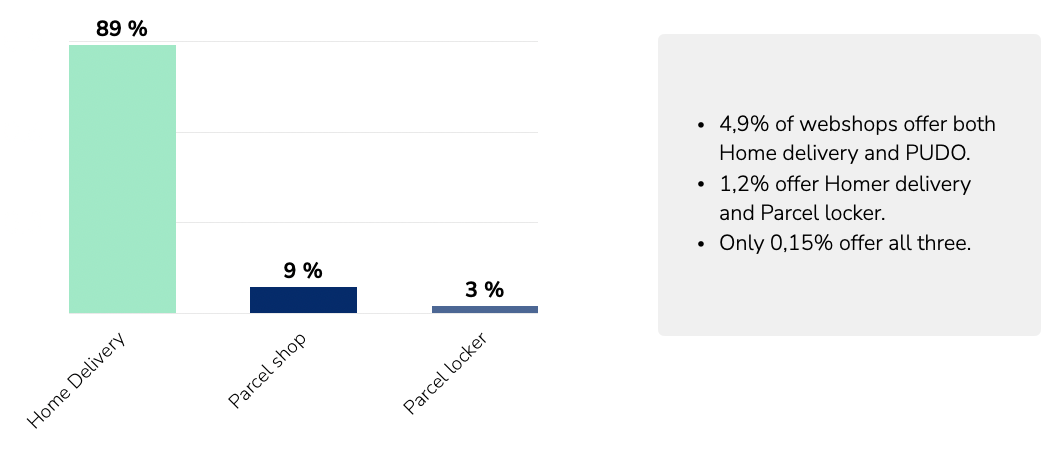

The limited share of OOH options reflects the market’s current infrastructure capacity rather than consumer demand alone. With continued investment from providers such as InPost, Poste Italiane, and DPD BRT, OOH coverage is expected to increase steadily over the next few years, giving retailers broader flexibility in how they structure delivery choices and costs.
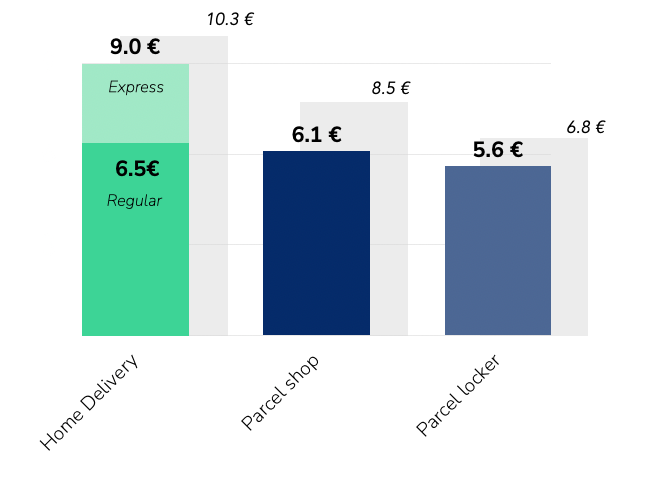
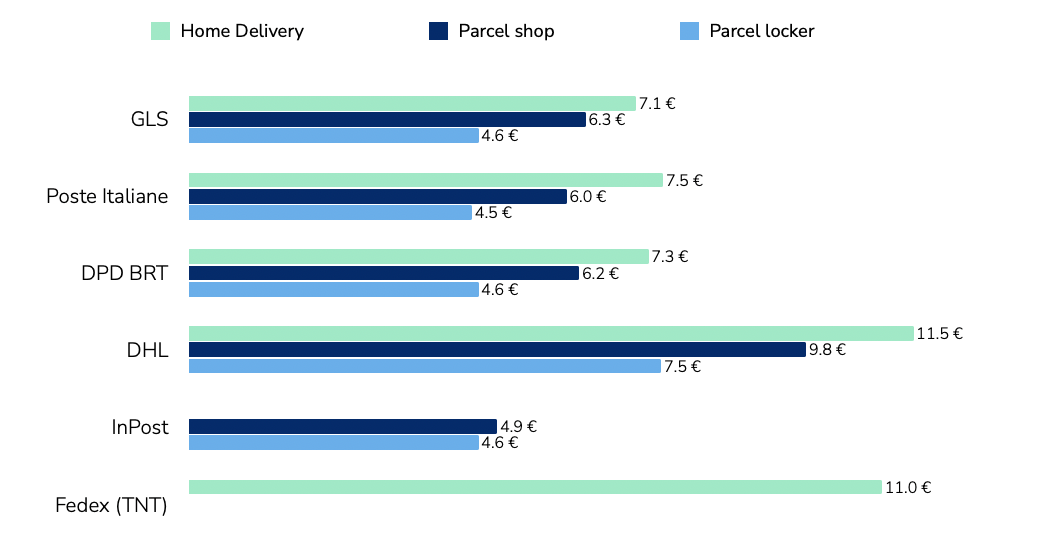
Pricing across delivery methods follows a clear hierarchy. Home delivery is the most expensive, with DHL and FedEx (TNT) positioned at the higher end in line with their express and international focus.GLS, Poste Italiane, and DPD BRT sit around the market average, reflecting large-scale domestic coverage and standardised pricing structures. InPost maintains the lowest price levels across OOH deliveries, consistent with its parcel-locker model and high network density.
The pricing gap between home and OOH - €6.5 vs €5.8 on average - highlights the economic rationale for providers to keep expanding out-of-home capacity, and in line with most other markets. As networks grow denser, these price differences will continue to influence retailer delivery mix.
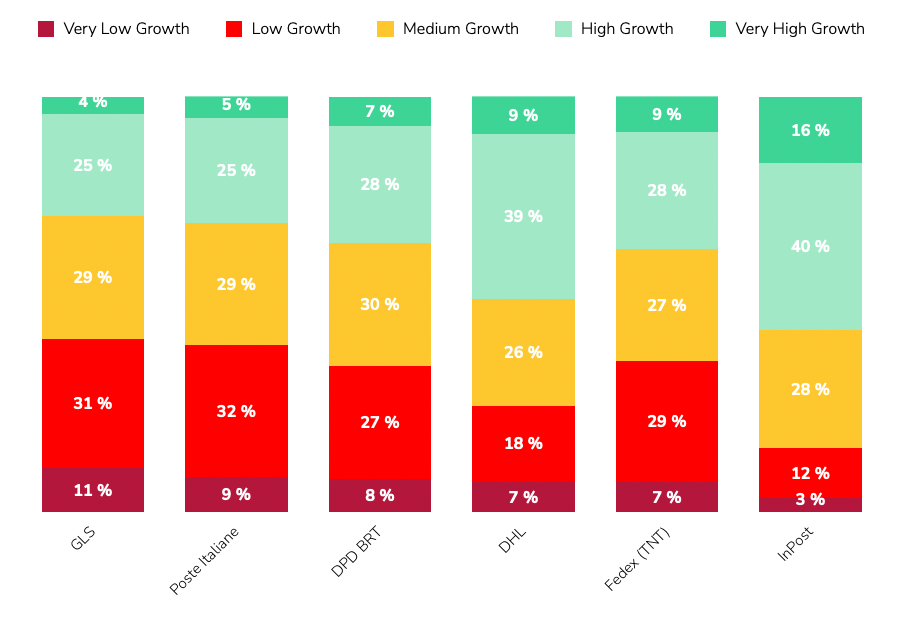
Tembi’s analysis segments retailer clients by size and growth outlook, showing how each provider’s portfolio is positioned across the Italian market.
This chart summarises the average retailer size of each provider’s client base on Tembi’s 0–100 scale, where higher scores represent larger and more established webshops.

The stacked bars show how each delivery provider’s clients are distributed by retailer size:
Using Tembi’s forward-looking Growth Indicator - a composite of product portfolio development, traffic momentum, financial proxies, and export activity - InPost has the highest share of high- and very-high-growth retailers, reflecting its alignment with fast-scaling digital merchants. DHL also skews towards higher-growth segments, supported by its express and cross-border strengths. Meanwhile, GLS, Poste Italiane, and DPD BRT hold proportionally larger bases of mature retailers, providing stability and recurring parcel volume.
Locker and parcel shop networks are entering a phase of rapid expansion across Italy.InPost leads with more than 3,000 lockers installed at the start of 2025. DHL and Poste Italiane jointly reported around 500 lockers by mid-2025, alongside an ambitious plan to reach 10,000 units in the coming years. DPD BRT, through its Fermopoint network, aims for up to 4,000 lockers within five years, while GLS initiated its own rollout during 2025.
This coordinated investment places Italy on a clear multi-year OOH growth trajectory, reshaping how carriers balance cost, capacity, and customer reach. The build-out is not just a convenience upgrade; it’s a structural shift in network economics - each new locker or parcel shop reduces last-mile cost per parcel and expands delivery capacity in urban areas.
Why it matters
Rising locker and parcel shop density directly influences:
As the network matures, OOH will become a central component of Italy’s last-mile infrastructure, shaping both consumer choice and carrier efficiency.
Tembi’s analysis highlights three practical dimensions that matter for market strategy and portfolio alignment.
1. Segment by retailer size and category
Italy’s retailer landscape is dominated by small and medium merchants, but larger and premium-category retailers - such as fashion, beauty, and consumer electronics - set higher expectations for service speed, reliability, and returns. Delivery providers should align SLAs, OOH coverage, and returns management to match those standards while maintaining efficient access to the long tail.
2. Model the price–mix effect
With home delivery averaging €6.5 and OOH €5.8, even a modest shift in checkout mix can materially improve cost-to-serve for both carriers and retailers. Tracking these dynamics by category and region helps identify where OOH incentives or dynamic checkout sequencing can achieve measurable margin impact.
3. Track portfolio momentum
Provider client portfolios differ in growth exposure. InPost and DHL are more concentrated among high-growth retailers, while GLS, Poste Italiane, and DPD BRT anchor the market’s stable core. Monitoring these shifts over time helps providers balance predictable SMB volume with faster-growing digital retailers, ensuring coverage across both maturity extremes.
Italy’s last-mile market is broad, price-competitive, and evolving. Method economics continue to favour OOH expansion as networks densify; provider portfolios show divergent exposures across retailer size and growth; and the locker build-out marks a long-term structural transformation rather than a short-term initiative.
This Italian last-mile delivery market analysis outlines the market map and comparative signals needed to inform planning, benchmarking, and partnership strategies across the sector.
Download the full Italian market report or schedule a Tembi demo to see your competitive view updated continuously.
Delivery fees across the Nordics have followed clear seasonal patterns and strategic adjustments over the past two years. Drawing on data from over100,000 webshops in Sweden, Denmark, Finland, and Norway between Q1 2024 and Q32025, we track how average consumer delivery prices (in EUR) have shifted.
This analysis zooms in on the Q4 holiday peak, highlights country-specific behaviours, and compares delivery methods in urban areas - parcel lockers, pickup points, and home delivery. The aim is to show how webshops shape their pricing strategies and how these evolve through the year.

Seasonality is a defining feature of delivery pricing in the Nordics. Q4, the peak holiday quarter, typically brings stable or higher fees rather than discounts. In late 2024, Black Friday and Christmas did not lead to cheaper delivery - instead, many webshops kept prices firm or lifted them slightly.
· Sweden: average home delivery rose from €7.60 in Q3 2024 to €8.00 in Q4, the annual peak.
· Denmark: small increases, such as parcel shop delivery at €5.89 in Q4 versus €5.83 inQ3.
· Finland: parcel shop fees jumped by around 5% in Q4 2024.
· Norway: parcel box delivery peaked during the holiday quarter.
The pattern suggests that in high-demand Q4, retailers prioritise covering fulfilment costs over cutting fees - even when running heavy sales campaigns.
This shifts in Q1, when prices correct downward. After the holiday rush, many webshops reduced or normalised fees:
This Q1 softness reflects the post-holiday slowdown in demand and renewed competition to attract consumers during a quieter season.
Q4 2024 stands out as a high point for delivery fees in several markets, corroborating that peak season surcharges and fewer free-shipping promos were in effect. In fact, during Black Week (Black Friday 2024), retailers across Noridcs reduced the prevalence of free shipping by 4% compared to 2023, opting instead to set spend thresholds or promote premium paid options (source: ingrid.com). In other words, fewer orders enjoyed “free delivery” in Q4 2024, as merchants nudged customers toward paid faster delivery or order bundling.This strategic move helped protect margins during the holiday boom – and consumers generally went along, paying for delivery when the value (speed, convenience) was clear (source: ingrid.com). The seasonal insight here is that peak demand doesn’t equal cheaper shipping; if anything, many webshops use the period to upsell premium delivery or maintain prices, rather than offer blanket free shipping.
Moving through 2025, the Q2 and Q3 2025 data show an interesting reset. By summer 2025, average delivery charges in many categories fell back to or below their levels from the previous holiday season. This sets the stage for how Q4 2025 might play out – which we’ll discuss in a moment.
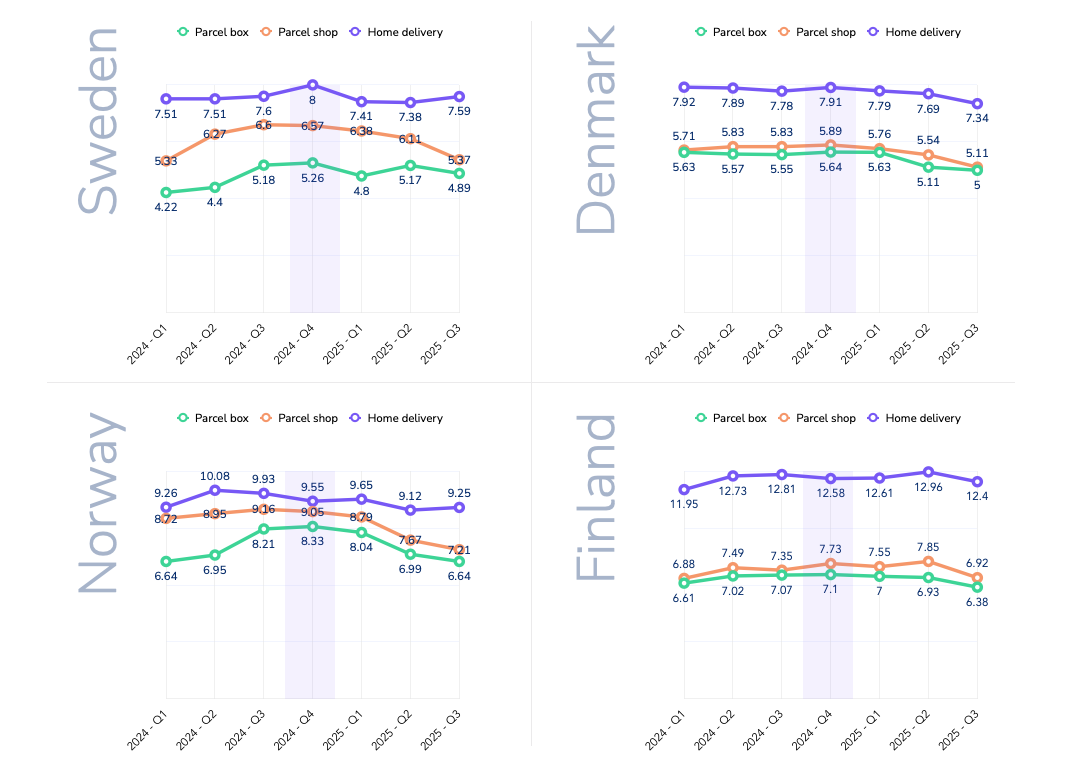
Each Nordic market shows distinct pricing dynamics, shaped by competition, consumer behaviour, and delivery costs.
Swedish webshops consistently post the lowest delivery fees in the region.In early 2024, prices were modest - around €4.20 for locker delivery and €7.50 for home delivery. These rose steadily through the year, with parcel box and parcel shop deliveries more than 20% higher by Q3/Q4. Home delivery peaked at €8.00 in Q42024, reflecting inflationary pressures and webshop/carriers passing higher rates on to consumers.
In 2025, the trend reversed. By Q3 2025, parcel shop delivery had dropped from €6.57 in Q4 2024 to €5.37 (an 18% decline),while home delivery eased back to €7.59. This points to intensifying competition, with Swedish retailers willing to cut delivery prices quickly to gain an edge.
Denmark’s delivery pricing remained stable through 2024, with parcel lockers and pickup points in the mid-€5 range and home delivery around €7.80–7.90. Even in Q4, increases were marginal- for example, parcel shop delivery at €5.89 in Q4 versus €5.83 in Q3.
The shift came in 2025. By Q3, parcel lockers averaged €5.00 and parcel shops €5.11 - 10–13% lower than the prior holiday season. Home delivery also dipped to €7.30 from €7.91 in Q4 2024. This gradual decline suggests Danish webshops began competing more actively on delivery price or carriers pressed the prices further down.
Finland remains the most expensive Nordic market for delivery - especially for home delivery. In 2024, Finnish shoppers paid €12–13 for home delivery, nearly double Sweden’s average. Out-of-home methods were also high at €7+. Prices climbed steadily through 2024, with parcel shops up 12% by Q4.
In 2025, home delivery crept even higher, peaking at €12.90 in Q2. But by Q3, parcel locker and shop fees had fallen sharply - down about 10% from Q2, back to early-2024 levels. Home delivery stabilised around€12.50.
Norway experienced the most pronounced swings. In 2024, home delivery peaked at €10.08 in Q2, while parcel lockers (€8.21) and parcel shops (€9.16) hit highs in Q3. Interestingly, Q4 home delivery was lower than earlier in the year at €9.55.
By 2025, Norwegian webshops had cut prices heavily, especially for out-of-home delivery. Parcel lockers fell from over €8in late 2024 to €6.64 by Q3 2025- a 20% year-on-year drop. Parcel shop delivery followed a similar pattern, down about €1.20 on average versus Q4 2024. Home delivery also eased slightly to €9.25 by Q3.
The widening price gap between home and pickup options suggests a deliberate push to shift volume to more cost-efficient methods. For carriers, Norway highlights how quickly competitive conditions can change - and the need to adjust pricing strategies in real time.
To summarize the country trends, Table 1 highlights how delivery fees in Q3 2025 compare to the last peak season (Q42024). Most markets saw notable declines in that period, especially for out-of-home deliveries:
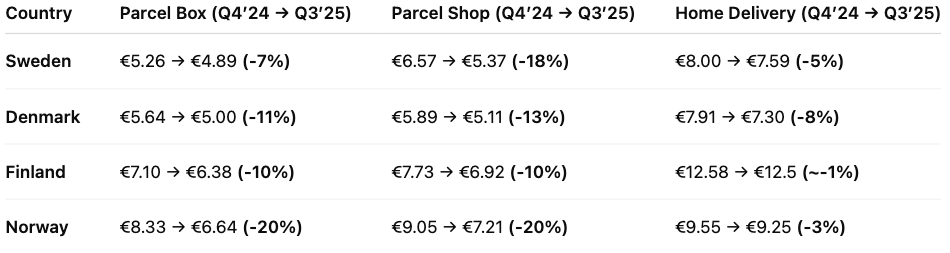
Data clearly shows that out-of-home delivery is significantly cheaper for consumers in urban areas – a natural effect when carriers can deliver 5–10 times more parcels per driver compared with home delivery.
Parcel box (locker) delivery
· Cheapest option across all markets by 2025(~€5–6.5).
· Prices spiked in 2024 (e.g. Norway €6.6 → €8.3)but dropped back sharply in 2025.
· Volatility suggests retailers test price sensitivity, then reset as competition kicks in.
Parcel shop(pickup point) delivery
· Typically a few cents above lockers, but fell notably in 2025.
· Norway: from ~€9 in 2024 to €7.2 by Q3 2025.
· Pricing gap with home delivery widened, creating strong incentives for consumers to choose pickup.
Home delivery
· Premium service, consistently the most expensive.
· Held steady through 2024–25: ~€7.5 in SE/DK,~€9.3 in NO, ~€12.5 in FI.
· Only small price drops, with Sweden (-13% YoY)the exception.
· Discounts remain rare and tied to high order values.
Out-of-home delivery became cheaper in 2025, while home delivery kept its premium. This reflects a conscious decision: steer demand towards lockers and pickup points to cut last-mile costs and ease peak-season pressure. Black Week 2024 showed the effect in practice - locker usage rose by four percentage points and delivery times improved as shoppers embraced flexible collection (source: ingrid.com).
For logistics providers and retailers, aggressive pricing on out-of-home delivery seems to become a core lever: it nudges cost-conscious consumers, reduces operational strain, while keeping satisfaction high. But the gap has limits - home delivery still anchors convenience expectations and remains a profit lever. The real challenge is balance: keeping lockers and pickups highly attractive without eroding the value or accessibility of home delivery.
Collaboration between retailers and logistics providers is key here, ensuring service levels meet expectations as more customers choose out-of-home - seen clearly during Black Week, when lockers not only gained share but also delivered faster on average (source: ingrid.com).
To keep the forecast transparent, we applied a simple model: for each country × delivery method, we took the Q4-over-Q3 seasonal change from 2024 and applied that ratio to Q3 2025 levels. Where 2025 trended lower than 2024, we also include a conservative midpoint between Q3 2025 and that baseline.
· Parcel box(lockers): €5.6–6.0
· Parcel shop(pickup): €6.1–6.3
· Home delivery: €9.0–9.2
Seasonal lift from Q3 to Q4 looks modest. Home delivery remains the premium option, while lockers and parcel shops stay clearly cheaper.
· Sweden: home ~€8.0 (flat vs last year); parcel shop ~€5.3 and lockers ~€5.0 (well below last year).
· Denmark: home ~€7.4; parcel shop ~€5.2; lockers ~€5.1 (all lower than last year).
· Finland: home ~€12.5 (still high); parcel shop ~€7.3; lockers ~€6.4 (both down year-on-year).
· Norway: home ~€9.25 (slightly below last year); parcel shop ~€7.1; lockers ~€6.7 (~20%down year-on-year).
Nordic delivery prices have eased through 2025 after peaking in late 2024, especially for out-of-home options (parcel box and parcel shop). Applying last year’s Q4-over-Q3 seasonality to current Q3 levels points to only small Q4 uplifts: lockers and pickups remain the low-cost choices, while home delivery stays premium and broadly flat.
Country patterns matter. Sweden and Denmark have lower 2025 bases and limited room for Q4 increases. Finland remains structurally high - especially on home delivery - so stability is more likely than hikes. Norway has corrected sharply this year, with retailers continuing to nudge volume toward cheaper lockers and pickups.
The underlying pricing strategies are clear:
· Continued shift to out-of-home delivery. Lower pricing here is deliberate - directing volume away from costly home delivery and easing last-mile strain.
· Home delivery as a premium anchor. Price cuts are modest; competition is about service quality (slots, ETAs, first-attempt success) rather than cents.
· Seasonal resets. After Christmas, prices ease in Q1—a cycle webshops use to stay competitive in slower months.
Finally, weigh this outlook against external factors that can quickly shift the picture: capacity constraints and consumer sentiment. If sentiment weakens, retailers may lean harder on thresholds and targeted incentives.
For most companies, two questions matter when looking at the e-commerce market: which webshops will grow and how large they are today. These are not easy to answer. Financial accounts are published once a year and often with long delays. Website traffic tools vary in accuracy. Sales input can be useful, but it is not consistent across markets.
Tembi approaches the problem differently. We track over 800.000 webshops in 22 European markets, visiting them every two weeks, and we convert that activity into a clear view of current size and likely growth.
From this data, we produce two measures.
Together, these outputs give a comparable and timely view of the market that has not been available before.
What makes this possible is the breadth of signals we collect. Every webshop is assessed on seven main areas:
It is the combination of these factors, updated every two weeks, that produces a reliable picture of both size and growth.
Older approaches depend on delayed filings, unstable traffic estimates, or anecdotal sales input. They describe the past, not the present. By contrast, Tembi provides a structured, repeatable model that updates with the market itself. A Danish fashion webshop and a Spanish electronics retailer can be measured on the same scale, and shifts in momentum can be detected months before they appear in official reports.
This is not prediction for prediction’s sake. It is about replacing guesswork with evidence that is current, structured and comparable.
Tembi provides a way to see the market as it develops — which webshops are growing, how large they are, and where categories are shifting. It offers the clarity needed to make decisions with confidence, based on how the market is moving today.
Growth predictions and Size estimation are available on all markets Tembi has been active on for more then three months.
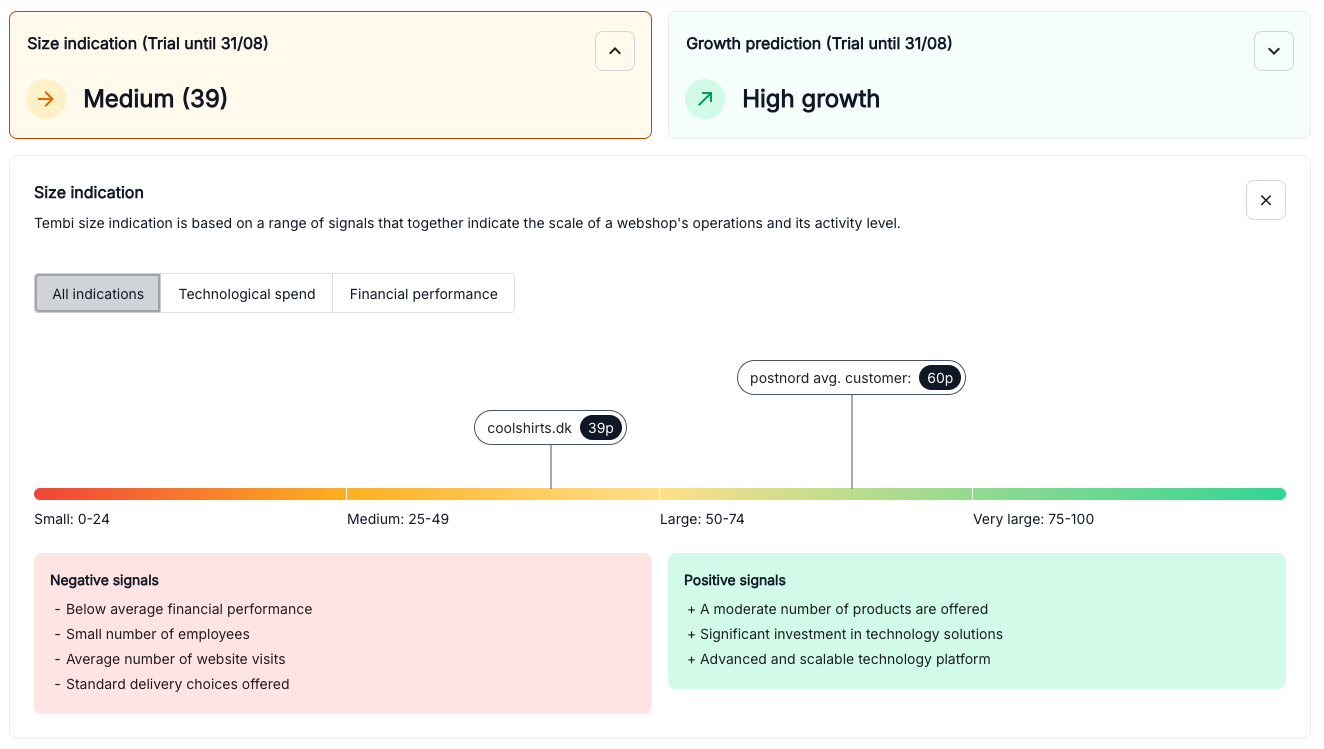
Knowing which webshops to focus on helps your business succeed. That’s why we've launched Tembi’s Size indication, a simple way to quickly understand how active and big (or small) any webshop is in the market compared to the largest online retailers.
What is the Size indication?
Tembi’s Size indications scores webshops from 1 to 100 points, dividing them into clear groups:
This makes it easy to compare webshops and see where they stand compared to others.
How does it work?
The Size indication uses hundreds of data points per webshop to decide each webshop’s score, including:
These factors, and many more, provide a clear picture of how active and large a webshop is. Each webshop’s score is clearly explained, showing both positive and negative factors.
Why the Size indication is useful
The Size indication makes market analysis simpler. You can quickly assess market size and find webshops that fit your ICP. When looking at thousands of prospects, Size indication allows you to sort all webshops, and see their size in relation to each other.
Combine Size indication with Growth Predictions
Tembi’s Size indication works hand-in-hand with our Growth Predictions feature. By combining these insights, you get a complete view of the market opportunity - clearly identifying which webshops are not only large and active but also likely to grow. This powerful combination helps you pinpoint the best opportunities for strategic action and growth.
Want to get started?
Log in to Tembi and check out the Size indication now. All Tembi clients have access to our Growth predictions and Size indication for free during July.
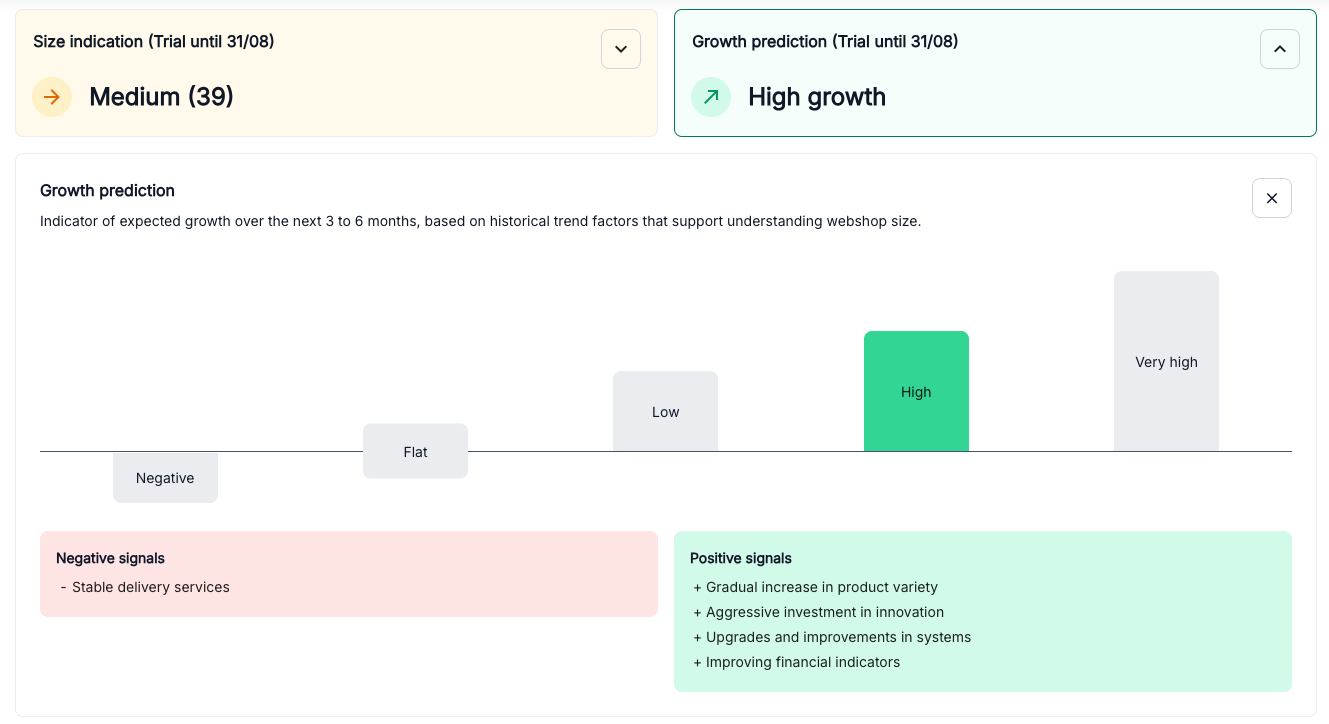
In business, knowledge is power, but foresight is transformational. Until now, most market intelligence relies on delivered reactive insights, offering clarity on the past or present but limited visibility into the future. Today, Tembi changes that by launching a groundbreaking predictive feature for e-commerce: Growth Predictions.
Why predictions matter
Understanding past performance is essential, but knowing what's coming next is where you truly gain a competitive advantage. With Growth Predictions, Tembi analyses hundreds of critical factors across hundreds of thousands of webshops, giving you a clear view of each retailer’s potential growth over the next 3 to 6 months.
How does it work?
Our unique predictive model evaluates comprehensive data points, including:
At the heart of this model is our proprietary AI-powered data collection methodology. For several years, we've meticulously collected, structured, and continuously updated vast datasets. Our advanced machine-learning algorithms use this rich historical data to identify patterns, learn from past behaviours, and generate precise, data-backed predictions. This ensures that our Growth Predictions aren’t guesses - they're calculated insights driven by robust AI techniques.
We translate these complex signals into straightforward, actionable insights, predicting whether a webshop will experience high growth, stability, or potential decline.
Transparent insights for smarter decisions
Growth Predictions don't just give you a simple score. They explain precisely why we anticipate certain growth patterns. For example:
This transparency helps you quickly understand the underlying strengths or vulnerabilities of any webshop.
Transform your commercial strategies
If you’re responsible for partnerships, sales, or logistics, Growth Predictions become your secret weapon. Prioritise your efforts, target the right segments and customers, optimise your resources, and proactively manage your commercial relationships by focusing on webshops that have a higher likeability to succeed.
First of its kind
No other e-commerce intelligence tool provides predictive growth insights at this depth. Using our unique dataset of retailers and product portfolios, we provide a comprehensive mapping of the e-commerce industry, helping companies plan strategically.
We update our dataset bi-weekly, ensuring teams can track prospects, provide insights and get a competitive advantage.
Interested in knowing more, book a demo with one of our experts.
Growth predictions are available for free as an early release during July for all our clients.
The retail industry is in the midst of profound transformation driven by two interconnected forces: the convergence of retail and e-commerce into a hybrid landscape, and the rapid integration of Artificial Intelligence (AI). These forces aren't just altering shopping habits - they're reshaping the entire retail value chain from manufacturing to fulfilment. McKinsey identifies these as key economic game-changers (putting aside broader geopolitical factors).
E-commerce has evolved beyond a simple digital channel into three overlapping segments:
• Manufacturers going Direct-to-Consumer (DTC): Brands like Nike, Zara, and Dyson build direct customer relationships through digital storefronts and direct shipments.
• Pure-Play digital platforms: Born-digital platforms like Zalando and ASOS innovate with personalisation and logistics, with some even branching into physical flagship stores.
• Traditional retailers adopting digital: Giants like IKEA and Walmart are integrating physical and digital experiences seamlessly.
These segments are merging into a highly competitive ecosystem where agility and market intelligence are essential. This blending doesn't simplify competition - it intensifies it, demanding constant vigilance and adaptability.
AI has moved from futuristic concept to operational necessity. Retailers leverage AI for personalised recommendations, dynamic pricing, predictive inventory management, and customer service automation, enabling smarter, faster, and more profitable operations.
Additionally, the expansion of cloud computing and the explosion of available data provide new opportunities to understand market dynamics in real-time. Historically, analysing every shelf in Europe was unthinkable; today, online data combined with AI makes large-scale, real-time market analysis entirely feasible.
A strategic framework for AI-enabled retail
Staying ahead requires a structured approach. Recently, Shish Shridhar from our partner Microsoft shared a strategic framework leveraging real-time data, AI, and automation, highlighting essential levers to drive growth.
Place – Sales channels: physical, digital, hybrid
Product – Assortment depth, availability
Value – Pricing strategy, perceived customer value
People – Customer service, store experience
Communication – Marketing, promotions, loyalty programmes
Systems – Technology infrastructure, analytics, automation
Logistics – Efficient supply chain, fulfilment methods, delivery
Suppliers – Vendor management, sourcing and COGS
At Tembi, we equip retailers and brands with large-scale market analytics derived from real-time data. We continuously track over 600,000 online retailers and 300 million products across Europe - among the largest datasets in the industry. By connecting this data with location specifics, company details, and AI-powered analytics, commercial teams gain clarity and confidence in decision-making, eliminating guesswork when it comes to understanding what drives growth.
As I see it, by unifying data across digital and physical touch points, market intelligence at scale enables smarter decisions in Product, Value, and Systems - helping businesses thrive in a hybrid, AI-first retail world.
• Based on the product categories that you excel in - which markets are then optimal, and in which geographies would it be optimal to promote and sell your products.
• If you have or plan to set up physical stores how are they threatened and compared to online retailers, and how is the specific area you think about investing in evolving. This will show whether you can expect optimal levels for sales per store and store traffic.
• Predict which product categories and brands to invest in, when you decide where to play - which product segments are you in with which brand and pricing strategies to drive market share and inventory turnover and hence sales growth.
• Understand the competition in the product categories and brands you are in and the strengths and strategies of the other players in the market.
Improve out-of stock-rate by finding out when products are sold over the year and if that differs in different geographies, and thereby make sure that availability is secured.
• Understand the current (or seasonality-defined) pricing in the market to increase gross margin, right-in-time markdowns, and possibility for price skimming but get an actual X-ray about the real price development in the market.
• When being present in the market, or especially entering a new one, you need to know how to make it successful. One of the important things to understand delivery market standards in different markets, e.g. OOH, home delivery, free shipping thresholds, delivery time etc. Some D2C try to negotiate a pan-European delivery contract without factoring ion the different market dynamics, or simply enter with the wrong expectations. This quickly becomes very expensive - e.g. if the customers are used to home deliveries and you go in the market wth parcel boxes, you would need to wait for that to be changed. Hence, very important to understand if you model fits to assure fulfilment accuracy.
Success in modern retail isn’t about choosing between physical and digital - it’s about blending them intelligently. In the era defined by AI and hybrid commerce, tools like Tembi provide retailers the crucial insights required to navigate complexity.
Whether you’re a DTC manufacturer, a digital-first retailer expanding your reach, or a traditional retailer enhancing your omnichannel strategy, winning demands strategic clarity grounded in data and real-time market intelligence.
f you knew which company would move within the next six, or twelve months, what would you do with that prediction?
During the last month I have talked with many Real Estate professionals within different sectors in the real estate industry, asking them the question how an understanding of companies moving intentions would change their work and approach. As expected, they all had different answers and saw different possibilities.
Below I have paraphrased three answers that stood out during my conversations.
“As a Real Estate Agent, I would analyze our commercial rental pipeline to identify nearby businesses in the right segment with a high probability of moving. Then reach out to them. But I would also use that knowledge when I try to close potential new clients.”
“Check our tenant status and see if anyone is about to move. The dialogue with our tenants is the most important thing, and this insight will allow me to reach out to them proactively, talk about their journey, and understand if their needs will change soon. So, we can make sure that they will be relocated and stay as tenants with us.”
“Of course, twelve months is a short time frame for us. However, previously, 12 months is far too short for us, but we are experiencing more frequently than before that large companies are not as inclined to commit to leases 24-36 months in advance. In addition to being very interested in understanding how an area is developing and where there will be a need for future offices, we would also use that knowledge to ensure we find tenants for our upcoming projects.”
Predicting if a company will move or not is not science fiction anymore. By continuously collecting and gathering millions of data points, we have at Tembi developed a Moving Prediction Score (MPS) that can predict with over 90% precision if a company will move within the next twelve months. That is about 20 times as good as a random guess.
Using artificial intelligence (AI) and gathering unique data, we can predict how a company will grow, how the number of employees will change and when they would need to move to new offices, as well as understand where they might want to move. Calculating the MPS, we do not only look at historical data, we combine different machine learning models and use this across industries and geographies. Our models are trained on 80 % of the company locations, and we test the models the remaining 20 % to see if we are right or wrong. And that is how we can reach a validated precision of 90%.
If you are interested in hearing more about how our Moving Prediction Score works, or how it can be applied to your business, do not hesitate to reach out to us.
ith our E-commerceMarket Intelligence Report, we have taken a deep dive into the e-commerce industry in Sweden, Finland, Denmark, and Norway to better understand delivery price differences, who are the dominant delivery providers and i.e. which technology providers power all the webshops.
The report is packed with data & insights to give the reader a better understanding of the market as well as the competitive landscape.

The nordic e-commerce is growing fast, with a market size of over €38 billion distributed over 76.000 webshops. Out of the regions 27 million people, more than 19.5million are online shoppers. It's also an exciting place for startups — over the past three months, 4,848 new webshops have opened up online.
All data in this report comes from Tembi’s E-commerce Intelligence Platform (EIP).
We don’t talk about consumer data in this report. We only focus on the businesses in thee-commerce industry, such as webshops, delivery providers, and technology providers.
Type in your details below, and get a version asap in your inbox.
n the fast-paced last-mile delivery sector, market intelligence is essential for success. By understanding your customers, competitors, and market trends, you can make informed decisions that lead to growth and profitability.
Market intelligence can help you identify new market opportunities, improve operational efficiency, and develop new products and services. It can also help you stay ahead of the competition and differentiate yourself from the crowd.
In this blog post, we have outlined a few specific examples of how last-mile delivery companies are using market intelligence to grow their businesses.
Staying ahead of the competition
Market intelligence can help last-mile delivery companies understand the competitive landscape and identify new ways to differentiate themselves. For example, a company might use market intelligence to identify new technologies that can help them improve their delivery services, or to develop new pricing strategies that are more competitive.
Identifying new market opportunities
By tracking market trends and customer behaviour, last-mile delivery companies can identify new markets to expand into or how green delivery is developing. For example, a company might identify a growing demand for same-day delivery in a particular city or region, or an understanding of the competitor's solution and market penetration of different delivery solutions.
Understanding website traffic patterns and consumer purchase behaviour
Last-mile delivery companies can today track which product categories are growing and which webshop’s are growing in popularity, as well as which international sites are exporting to one’s country. By doing so, last-mile delivery companies can establish early partnerships abroad and better equip themselves for future demands and growth.
Developing new products and services
Market intelligence can help last-mile delivery companies understand the needs of their customers and develop new products and services that meet those needs. For example, a company might develop a new service that delivers packages to customers' workplaces, or a possibility to get delivery at very specific times in the evening.
Improving operational efficiency
Market intelligence can help last-mile delivery companies optimise their delivery routes, reduce costs, and improve delivery times. For example, a company might use market intelligence to identify the best locations for new warehouses, or to develop more efficient delivery schedules.
Getting good data for Market Intelligence is not easy, as it requires a lot of time, and quite often a big investment in data infrastructure and a plan to keep high quality and ensure data is actualized. Hence, many decisions are taken without bringing external factors into the mix or using poor data as a ground.
Different Market Intelligence platforms collect different types of data and can help companies better understand the market dynamics. Here are a few tips and suppliers for getting started with market intelligence.
As with any strategic decision, starting the process, you need to define your goals. Market intelligence is not an answer, it is a tool. Are you looking for growth within a particular type of webshops, or price development of different delivery methods? Or a more complex question around identify new market opportunities. Once you know your goals, you can start to identify the data and insights you need.
Collect data
There are many different sources of market intelligence data, including customer surveys, industry reports, and government statistics. You can also collect data from your own internal systems, such as sales data and customer feedback.
Analyse the data
Once you have collected data, you need to analyse it to identify trends and insights. You can use a variety of tools and techniques to analyze data, such as data analytics software or more advanced methods using machine learning.
Share the insights
Once you have gained insights from your market intelligence data, you should to share them with your team to gather input, feedback, and get new ideas so you can keep iterating your work. You can either do a presentation or set up a dashboard that monitors the data and actualises your insights.
Our E-commerce Intelligence Platform – EIP – monitors every webshop on the market, and provides data around providers, prices, and delivery methods. This data can be filtered from a webshop category perspective or for example revenue, providing a comprehensive overview and intelligence of the market and competitors. Hence, EIP both collects and analyses the data, and provides (shares) the insights in simple overview. In other words, decision-ready intelligence.
ith the E-commerce Intelligence Platform (EIP), we have set out on one of our most ambitious data and analytics ventures yet: to authenticate and catalog every webshop globally, defining product categories, individual products, and the delivery infrastructure. Our aim is to build the most expansive and current e-commerce database, one that can proactively empower webshops, carriers & delivery providers, and suppliers to navigate through the dynamic, ever-expanding market.
EIP was first introduced in Denmark in 2021 and has since extended its reach to Sweden, Norway, Finland, the Netherlands, Latvia, Lithuania, and Estonia. To date, we systematically and repeatedly index, validate and analyze over 200,000 webshops, classifying them into different product categories.
So, why embark on this colossal task?
The objective behind EIP is to provide the industry with unparalleled Market Intelligence. To achieve this, it was imperative for us to go beyond the surface-level offerings and gain a deep understanding of the last-mile delivery mechanics, the various providers involved, and the pricing structures.
All webshops in one place
EIP offers a comprehensive market overview, identifying and validating every operational webshop, while discarding inactive ones. We have established a direct link between each webshop and its owner, detailing ownership, headquarters, and financial figures. By evaluating the webshops' offerings and categorizing their products, we understand the technological platforms utilized and the delivery services provided, including pricing and export capabilities.
Our "Market Scrape" equips users with a detailed snapshot of all webshops in a specific market. For deeper insights, particularly into the largest, custom-built webshops, our "Custom Scrape" service offers an in-depth analysis.
Checkout monitoring
Understanding the last-mile market, we monitor each delivery checkout on all webshops, gathering information about providers and their position on the list of delivery options, delivery methods and prices, free-delivery threshold, and green delivery options – giving us comprehensive view of the shipping market and how it evolves from a public perspective.
We keep a pulse on the last-mile delivery market by continuously monitoring checkout processes across webshops. This monitoring captures data on delivery providers, their ranking in delivery options, pricing strategies, thresholds for free delivery, and eco-friendly shipping options, thereby offering an overview of the evolving shipping landscape.
Decision-ready Market Intelligence
Merging our data with metrics like order volumes allows last-mile delivery providers to proactively respond to changes in their checkout positioning, preventing potential revenue drops.
“Prior to Tembi, identifying a lost position at a store’s checkout could take up to six weeks, during which we would lose about 64% of order volumes. With EIP's immediate updates, we can swiftly address the issue, preventing significant revenue losses”
Webshop integration manager
Let us say you charge €3,0 per delivered package and expect 100 packages per day (on average). The daily revenue is €300. Losing 64% of the volume equals to a loss of €192 per day. During six weeks that loss amounts to €8.064.
With EIP, as soon as a positioned is lost, you are notified, and can talk to the store, and manage your delivery operations immediately.
From a strategic perspective, both as a webshop owner, as well as delivery provider, you can track which delivery methods are popular, what are the market prices, and where is the market developing, both on your own market, but also abroad.
Automated lead generation
Understanding the supplier network of providers for webshops within different fields - delivery, payments, and technology - opens an overview of who works with whom. Giving providers competitive intelligence and a perfect data set for lead generation and prospecting.
As a delivery provider, being able to see all your clients in one simple overview with metadata, you will equally see where you are not present. By understanding previous relationships and solutions used, you can improve your sales pitch and competitive edge.
There are multiple ways to use EIP and the data. Here are a couple of examples.
EIP for Account Managers
See what technologies your clients are using, and which providers they work with. If you work with last-mile delivery, you can see your position in each check-out and follow your client's business and get the latest data before your check-up.
EIP for prospecting
Whether you work with professional services for webshops or selling software, you can find each webshop on your market and find precisely the type of webshop you are looking for with our filters.
EIP for Business Development
See and follow market trends, track your competitors and always be up to date.
EIP for Customer Success
From the moment you have a new client, follow the implementation and results. Track critical changes and get access to detailed customer business information.
EIP for Analysts and Business Intelligence
Via our API you can extract all our data to your own system and combine external data with your internal data to track correlations, get a full competitor, and market overview.
“A dynamic market requires ongoing data collection.”
Christian Mejlvang, head of product at Tembi
Our data foundation is robust, encompassing over five billion data points, which include both real-time and historical data collected from 2021. We augment this repository daily with over one million data points to guarantee not only the high quality of our data but its relevance as well.
Utilizing diverse machine learning techniques such as AI (Artificial Intelligence), NLP (Natural Language Processing), LLM, and image recognition, we convert raw data into actionable intelligence, aligning with our commitment to transforming data into insight. This data undergoes a process of enrichment, contextualization, and multi-level automated verification to ensure its integrity. We categorize our data into three tiers of quality—Bronze, Silver, and Gold—and it is only the Gold-standard data that is displayed on the EIP platform, reflecting our dedication to the highest standards of excellence.
Our data acquisition strategy is multifaceted: 1) sourcing open data, 2) procuring datasets from various providers, 3) deploying our proprietary scrapers to gather exclusive data, and 4) generating novel data through analytical methods applied to the data we have. This fourth approach underpins our Predictive Market Intelligence service.
We employ a combination of econometric and predictive machine learning models to create proprietary datasets. These are instrumental in our analysis of market trends and trajectories, providing an innovative perspective on market dynamics.
Interested in knowing more about EIP? Contact us.
here are many “intelligences” in the world of business. Besides the cognitive ability of a business’s staff, it refers to the information that has been gathered, analysed, and presented in a way that is useful for decision-making. It is not just raw data; intelligence is actionable information that provides insight into a particular subject, such as a competitor’s activities or internal business capabilities. "Intelligence" is a multifaceted term that usually denotes a high level of understanding, awareness, or information processing, whether by humans, collectives (like organizations), or technology.
What type of intelligence is needed often depends on what strategic decision you are looking to make, what type of resources you have, and the amount of data. Here are the ten most common ones:
Business Intelligence is a technology-driven process for analysing data, presenting actionable information to help executives, managers, and other corporate end users make informed business decisions. BI encompasses a variety of tools, applications, and methodologies that enable organizations to collect data from internal systems and external sources, prepare it for analysis, develop and run queries against the data, and create reports, dashboards, and data visualizations. This process offers comprehensive business metrics, often in real-time, to support better decision-making. With BI, businesses can focus on data-driven strategies to address weaknesses and capitalize on strengths.
Market Intelligence is the gathering of relevant data about the entirety of a company's market space. It covers broad spectrums such as understanding industry trends, identifying market opportunities, and detailed insights into competitors and customers. This intelligence is crucial for forming market entry strategies, pricing models, business development and sales & marketing initiatives. It aids businesses in anticipating market shifts and consumer needs, enabling proactive rather than reactive strategies. The insight gained from market intelligence informs various strategic decisions, such as market opportunity assessment, market penetration strategy, and market development.
Marketing Intelligence is the practice of collecting data from a variety of sources about the market environment a business operates in. It includes the analysis of consumer behaviour patterns, campaign outreach, and purchase triggers. The focus is to understand the success of marketing efforts and to gauge the sentiment and preferences of current and potential customers. It influences tactical marketing decisions and helps businesses adapt their strategies to better meet consumer expectations, enhance brand loyalty, and optimize return on marketing investment.
Competitive Intelligence refers to the systematic collection and analysis of information about competitors and the competitive environment. CI aims to provide a complete picture of the marketplace and the forces at work within it, encompassing aspects such as competitors' strategies, market developments, new entrants, and technological advancements. Effective CI provides a legal and ethical means to anticipate competitive moves and stay ahead of industry trends, supporting strategic planning and risk management.
Customer Intelligence (CI) is a sophisticated analysis of customer data designed to create comprehensive portraits of ideal customers to better understand and predict their behaviour. It is an advanced step beyond basic customer service, seeking not just to address customer needs but to anticipate them. CI combines demographic and psychographic data with transactional and behavioural insights to paint a detailed picture of current and potential customers. This intelligence helps in personalizing marketing strategies, enhancing customer experiences, and boosting customer loyalty. In the age of big data, companies leverage machine learning and AI (Artificial Intelligence) algorithms to process vast amounts of information, providing a deep dive into customer preferences, pain points, and potential opportunities for cross-selling and up-selling.
Financial Intelligence combines understanding a company's financial health with the savvy to use this data in making robust decisions. It involves the analysis of financial data like cash flow statements, balance sheets, and income statements to grasp a company's financial condition and forecast its future performance. It is not just about number crunching; it also includes reading between the lines of financial statements to identify the underlying performance factors, assessing the company's fiscal policies, and ensuring regulatory compliance. Financial Intelligence helps in capital budgeting, financial planning, and aligning financial goals with corporate strategy.
Operational Intelligence (OI) is the real-time dynamic, business analytics that delivers visibility and insight into data, streaming events, and business operations. OI solutions run query analysis on live feeds and event data to deliver real-time operational insights. It involves understanding and optimizing labour productivity, machinery performance, and other operational sectors. By integrating and analysing data from various operations, businesses can quickly identify and address inefficiencies, ensuring the smooth functioning of processes and supporting continuous improvement.
Sales Intelligence refers to technologies, applications, and practices for the collection, integration, analysis, and presentation of information to help salespeople keep up to date with clients, prospect data, and drive business. It includes a range of activities, such as tracking customer data and interactions, social media monitoring, and sales forecasts. With accurate and insightful sales intelligence, sales teams can enhance their productivity, improve lead generation and conversion rates, and drive increased sales and profitability.
Product Intelligence involves collecting and analysing data concerning one's products and those of competitors. It is pivotal in understanding how a product performs across its lifecycle, which features resonate with customers, and what improvements should be prioritized. This intelligence is crucial for product development, management, and innovation, informing companies about user feedback, product usage patterns, and market demands. By leveraging product intelligence, businesses can tailor their product offerings to better meet customer needs and stay competitive in the market.
Technological Intelligence is the systematic gathering and analysis of information about the technological environment of a business to aid decision-making. It includes tracking trends in technology advancements, research and development within the industry, patent filings, and regulatory changes. With a solid technological intelligence strategy, a company can foresee technological disruptions, identify new business opportunities, innovate, and maintain a competitive edge. This intelligence is vital for strategic planning, particularly in industries where technology evolves rapidly and is a key differentiator.
Many types of intelligences are not exhaustive and often overlap. Businesses typically leverage a combination of these intelligence types to inform various functional and strategic areas within their organizations.
aking a decision is easy but knowing how to make the right decision at the moment of choice, now that is tricky. As the outcomes and consequences are only known after the decision has been made, we try hard to mitigate the risk of making a wrong one.
Like a game of probability, we weigh different information and data, and play out the possible outcomes against each other to narrow down our choices, and, well, make a bet. Given the vast amount of information and data available, gathering the needed and relevant information can be a challenge. For the human mind it is impossible to grasp all inputs and data at once. And it is practically impossible. Additionally, as we learn new information, we may create new connections and gain new insights that open new possibilities. Which often leads to the question, "What if...?"
Lastly, before executing the decision, we weigh our options and evidence, and filter it through the personal and/or corporate value filter. By repeating this process, and adding a decision-review step, we learn how to make better decisions. The more we know, the more experience we have, the better our chances of making the best possible choice. And that is how it has been for the last ten of thousands of years.
While we have evolved our ability to gather and access information with software, and made the analytical part simpler and more accessible, machine-assisted decision making and execution is about to change the decision-making process.
The human brain can process 11 million bits of information per second, but our conscious minds can handle only 40 to 50 bits per second. And while we do not always forget, retrieving the right information at the right time is not straightforward.
Our ability to gather and analyse data is limited by our knowledge, time, and “computational power.” However, if we know what information we need, there are now thousands of tools that can help us gather the data and connect it with other data sources to uncover new insights and patterns.
Predicting the future based on historical patterns is not a complicated science, but rarely a trustworthy one. Machine learning algorithms have increased the accuracy and given us a better foresight of how decisions and events might unfold, making it possible to simulate different scenarios and study decision consequences without having to execute a decision. The possibility of setting up “What-if” scenarios and playing them against each other, pushes us closer of being able to make the right, rational decision.
Building on the previous point about the importance of good data, let us talk about the challenge of data diversity. Machine learning models are only as good as the data they are trained on. If you train a model on a narrow dataset, it will only be able to make predictions that are relevant to that dataset. For example, an automated script writer that is only trained on movies and books written by Quentin Tarantino will always produce scripts that are similar to Tarantino's work. The same thing happens if you run your analytics only based on your company's internal data without considering external data such as market and competitor data.
Powerful and accurate models combine data from a variety of sources to reduce bias, improve generalisation, and identify new patterns and insights. For example, a company that is developing a model to predict customer churn could combine data from its internal CRM system with data from external sources such as social media and customer reviews. This would help the company to identify patterns and insights that it would not be able to see by looking at its internal data alone.
The one type of analytics that will profoundly change our decision-making process, and profoundly change how we work, is prescriptive analytics.
Prescriptive analytics is (currently) the final stage in the analytics spectrum, which includes descriptive, diagnostic, predictive, and prescriptive analytics. Descriptive analytics answers the question "What happened?", diagnostic analytics explain “Why it happened!”, predictive analytics addresses "What might happen?", and prescriptive analytics tackles "What should we do about it?", including all former analytics in its process.
When we make decisions, all these analyses happen naturally in our brain and are part of our decision process. The extent of how much we analyse depends on the time we have, the number of people involved, and the consequences of the decision. If we have little time or the stakes are low, we may make a quick decision with minimal analysis. However, if we have more time or the stakes are high, we will spend more time trying to analyse the situation and considering our (imagined) options.
If we turn to machine-assisted decision making powered by prescriptive analytics many of parts of decision process become automated. Using machine learning, algorithms, and computational modelling, prescriptive analytics provide insights, simulates different scenarios, and suggest actionable steps in response to a predicted outcome or scenario.
For example, in supply chain management, prescriptive analytics might suggest optimal routes for delivery based on predicted weather conditions, anticipated traffic patterns, and historical accident data. Or, in finance, it could recommend investment strategies based on a forecasted economic downturn.
A step-by-step decision-making process includes most commonly these seven parts:
Imagine that you have a data foundation that gathers all your data in one place, both external open data (market, competitors etc.) and internal. You have billions of rows of present and historical data, cleaned, enriched, and contextualised. You are a Business Development Manager at a Last-Mile delivery company, and you are tasked with expanding sales to a new area. Where do you start?
1. Identify the decision
In which geographical area can we increase our revenue the most?
2. Gather information
Where are our competitors present?
What are our competitors' prices?
Where are our terminals?
How much are we today delivering in each area?
What delivery options are the most popular in which area?
What investment will be needed for each area?
Etc.
3. Identify alternatives
All areas and options are listed. Business cases are presented.
4. Weigh the evidence
Alternatives are weighed against each other. Pros and cons are discussed.
5. Choose among the alternatives
Once you have weighed all the evidence, you are ready to select the alternative that seems best for the company. You may even choose a combination of alternatives.
6. Take action
You implement the chosen alternative. It is time for execution.
7. Review the decision
You review the results of the decision and see how your expansion plan is working out and iterate.
With prescriptive intelligence in place, the machine assisted decision-making process is similar, but at the same quite different as the effort lies in the beginning, and not the collection of information. We assume here you have access to a tool that combines market data with internal data.
1. Identify the decision
In which geographical area can we increase our revenue the most?
2. Goal formulation (prompting)
What are the results that you are looking to achieve and through what means. List interesting areas for exploration and factors you think are relevant.
3. Scenario evaluation
Alternatives and scenarios are simulated and presented by the AI describing the steps needed to reach formulated goal. Costs and risks are listed based on data that is available. You have the possibility to deep dive into areas to expand your analysis or follow the recommended path.
4. Weigh the scenarios
Recommendation is weighed against the other scenarios.
5. Scenario implementation
You implement the chosen scenario and measure against milestones and goals set by the AI.
6. Review the chosen scenario
The decision and chosen scenario are evaluated in real time with the AI to ensure ongoing learning and optimisation.
If we look past the fact that much of the decision-making process is automated, we move from hypothetical discussions around outcomes and consequences to an evaluation of the proposed steps to reach the decision and set goal. The proposed scenario is not unbiased and unemotional, it is guiding force explaining how to reach that goal with what is available.
Science fiction?
Prescriptive intelligence is not something we imagine anymore, it is being worked on today, and there are already solutions in the market for specific use cases. Our decision-making process will not only be faster (timewise), but we will also be able to be much more accurate in understanding outcomes and the decisions in between we need to make to reach a certain goal.
If everyone can afford the same tools and have access to the same data, isn't there a risk that we will all pull towards the same goals in our respective fields? Isn’t it all about increasing profit through expansion or decreasing costs?
The chances of that scenario are limited.
Not one company has the same data as another one. We can acquire datasets, predictions, but in the end how we operate, they people we employ, the decision we made, and our assets and business models are not the same. Each company has its own strategy, so even if we all access the same market intelligence, the outcome will be different. But just as generative AI has shown with ChatGPT and Midjourney, the playfield has become much more even.
Market analysis and expensive data is becoming less expensive and available to a larger extent of companies, and not only the big ones.
A general prescriptive analytics platform is still a couple of years in the future. At Tembi, we have built the data foundation for it, and are constantly working on adding new machine learning based prediction and econometric models to create better insights and foresights for our clients based on open data.
While companies have their internal data, we provide extensive access to open data, and ready-to-go-analytics – or market intelligence – that provide actionable insights to the decision-making process. Many of our clients use our API to connect their data with our data to examine and understand (i.e.) volume fluctuations (revenue drivers) with external events, and hence be able to understand how external factors impact their business, mitigate risk, or uncover new business possibilities.
The more we connect the world's Information the better we will understand the future, and the more impact our decisions will have. And that is why we work here at Tembi. Until we provide a general prescriptive intelligence platform for executing successful business decisions, we focus on providing market intelligence that is beyond what can be seen by a person online. We combine data from multiple industries and build market predictions models based on changes across different industries.
n today's data-driven world, the abundance of information and the advancement of analytical tools have sparked a competitive quest for insights. As data becomes more affordable and accessible, the ability to use this data effectively becomes a decisive factor in staying ahead. But having data is one thing; making sense of it to predict the future is quite another. It is a complex task that goes beyond just crunching numbers—it is about weaving together diverse parts of information, both old and new, to form a clear picture of what lies ahead.
This article aims to untangle the concept of Predictive Market Intelligence, demonstrating how it operates and its value in a business context. We will look at how this approach to data can lead to smarter decisions and how it is shaping the way companies move forward.
Predictive Market Intelligence (PMI) stands at the confluence where big data analytics, artificial intelligence, and advanced market research meet. It is the art and science of collecting vast amounts of open data - from (i.e.) market trends, company behaviour, to global economic indicators - and analysing them to forecast future market conditions. The aim of PMI is not only to investigate information based on past market performance – historical data – but to forecast the evolution of markets, specific industries, or companies, by employing diverse analytical methods and algorithms.
Unlike traditional market research, Predictive Market Intelligence is dynamic, constantly refining its insights with a steady stream of real-time data. This process enables businesses to not just interpret the present but also to anticipate and prepare for future market developments, gaining foresight and deepening their understanding of potential future scenarios.
If companies can use Predictive Market Intelligence to gain foresight, can PMI be applied everywhere, or are there particular interesting applications of this approach to market analysis and strategy? Here are a couple of examples:
Retrieving Market Intelligence is a question of gathering data from various sources, organising the gathered data, and applying different technologies to validate, enrich and put the data into context. The last step is to apply different analytical models depending what outcome one is looking for. So, where the first step is about gathering (open) data, the second analytical step is the creation of synthetic data (programmatically generated data).
Each step of the process, from open data to intelligence, uses different technologies. Each plays a unique role and function, but applied together, collectively, these technologies can create incredibly precise projections. Let us dive into a couple of them.
Central to Predictive Market Intelligence is the process of data mining and aggregation. This involves the meticulous gathering of vast volumes of data from a multitude of sources like public information, financial reports, and for example websites. The objective is to amass a comprehensive dataset that encapsulates the diverse aspects of the market and company behaviors. This rich tapestry of data forms the foundation upon which further analysis is built.
Artificial Intelligence (AI) and Machine Learning (ML) stand at the core of Predictive Market Intelligence, processing and interpreting the extensive data collected. AI algorithms are adept at discerning complex patterns and relationships within the data, which are often imperceptible to the human eye. Simultaneously, ML models, with their ability to learn and improve from the data, continuously refine their insights, ensuring they remain relevant and accurate in a rapidly changing market.
A key component in understanding context is Natural Language Processing (NLP). NLP technologies delve into text-based data, analysing news articles, pdfs, and websites. They are particularly effective in understanding the context of the written text, and being able to synthesis substantial amounts of data and help verify what the data is
Predictive analytics brings a forward-looking perspective to Predictive Market Intelligence. By employing statistical and econometric models as well as forecasting algorithms, it anticipates future market behaviors, trends, and company needs. This facet of Predictive Market Intelligence is instrumental in risk assessment and scenario planning, allowing businesses to prepare for various future market scenarios.
Big Data Analytics provides the muscle to process and analyze the immense datasets characteristic of Predictive Market Intelligence. It offers real-time analysis and sophisticated data visualization tools, making complex data understandable and actionable. Complementing this is cloud computing, which offers the necessary infrastructure for data storage and analysis. Its scalability ensures that businesses can adapt to varying data demands, while also offering cost-effective solutions compared to traditional in-house data centers.
Predictive Market Intelligence is not only for experts. With platforms such as Tembi, PMI is today accessible for everyone, regardless of analytical skill set. While there are use-cases that require tailormade algorithms, predictions such as company growth, market trends and econometric forecasts are already available. And with decision-ready market insights, companies can quickly adapt to a data-driven decision process without heavy investments.
For the expert, Predictive Market Intelligence serves as an advanced tool that complements and elevates their analytical skills. PMI can be used to validate hypotheses, refine models, and conduct in-depth analyses that underpin robust, strategic decisions.
The technology used in Predictive Market Intelligence lets experts quickly sort through and understand huge amounts of data. This means they can get a clear picture of how markets are changing, what competitors are doing, and how companies are behaving. With this kind of intelligence, experienced professionals can make accurate predictions and find new business opportunities before anyone else does.
For those new to Predictive Market Intelligence, it can seem both exciting and a bit overwhelming at first. But this technology simplifies the process of understanding the market by turning complicated ideas into clear insights. It provides easy-to-use tools and clear visuals that help make sense of complex data.
With Predictive Market Intelligence, even those just starting out can get a complete view of the market. They'll learn to spot the important signs that show changes in what consumers want or in the economy. This technology is like having a guide and a coach in one, helping new users think strategically and make decisions based on data.
Predictive Market Intelligence acts as a bridge between theory and practice, enabling a fluid exchange of knowledge across all levels of expertise. It is a field that values the knowledge of the expert and nurtures the growth of the newcomer. By fostering an environment where learning is continuous and insights are accessible, Predictive Market Intelligence ensures that all users, regardless of their level of expertise, can contribute to and benefit from the intelligence it provides.
The future of Predictive Market Intelligence looks particularly promising as cloud computing costs, which have been a significant factor in the past, are expected to continue their trend towards more economical and efficient services. As the price-performance ratio of technologies like GPUs improves, companies can leverage more powerful analytical capabilities at a lower cost. This could further democratize PMI, allowing smaller businesses to engage with what was only accessible to larger corporations. The integration of emerging technologies such as distributed cloud and advanced AI (Artificial Intelligence) algorithms will further enhance PMI's accuracy and speed, offering businesses of all sizes the predictive insights needed to stay ahead in an increasingly data-centric world.
What will be key, as always with the development of analytics and AI, is the quality and the amount of data. With a democratization of technology, the winners will be the ones that invest in good data gathering processes – both internal and external open data – and have solid data partnerships in place.
One thing is sure, we have only touched the very beginning of this approach. But already today, it is evident that companies that utilize external data in their decision process, have far better chances of making better decisions. Giving them a better competitive edge.

Sorry, no results match your search criteria. Please try a different keyword or browse our categories for related information.


Italy counts 94,724 online retailers, with clothing, groceries and beauty leading the mix, average home delivery cost at €6.5 and OOH at €5.8. With continued investment and InPost’s strong market entry, OOH delivery is expanding rapidly and reshaping the competitive landscape. This Italian last-mile delivery market analysis maps the structure, methods and provider portfolios behind the numbers.
Working in last-mile delivery and interested in another competitive market analysis beyond Italy? Let's connect. Download the full report here.
Italy remains one of Europe’s most active e-commerce markets by merchant count and parcel flow. To help last-mile executives benchmark strategy, this report profiles the market composition, delivery method availability and pricing, and the competitive landscape across six core providers: GLS, Poste Italiane, DPD BRT, DHL, InPost, and FedEx (TNT). You’ll see where demand concentrates by category, how pricing positions each method, and how provider client portfolios skew by retailer size and expected growth.
All figures are derived from Tembi’s continuous monitoring and analysis of Italian online retailers and checkout setups, with consistent taxonomy and normalisation to support like-for-like comparisons. Use it to maintain competitive advantage, capture share in attractive segments, and understand market dynamics with clarity.
Quick takeaways
Italy’s 94,724-strong retailer base skews to clothes & shoes (≈12.1%), then food & groceries (≈6.7%), and beauty (≈5.4%). The size pyramid shows most merchants are medium, fewer large, and about 1% very large, indicating a wide long-tail with concentrated head accounts that influence parcel mix and service expectations. The latest available data from 2020 suggest that around 830 million parcels are shipped domestically each year. Given the latest e-commerce growth estimation of an average annual growth rate of 4.5%, parcel volumes could now be approaching one billion shipments.
GLS and Poste Italiane hold the broadest presence across Italian webshops - GLS appears in 48.7% of retailer checkouts and Poste Italiane in 46.3%. DPD BRT, DHL, InPost, and FedEx (TNT) follow, forming the rest of the competitive landscape.
When looking at the first delivery option offered to shoppers, GLS leads with roughly 30%, followed by DPD BRT (26%) and Poste Italiane (22%).This ordering pattern reflects how retailers prioritise providers based on network reach, reliability, and negotiated terms rather than pure visibility.
In short:
Across Italian retailers, home delivery remains dominant, offered by roughly 89% of webshops. Parcel shops (≈9%) and parcel lockers (≈3%) are still at an early stage of rollout, but both formats are expanding as networks and integrations mature.
The limited share of OOH options reflects the market’s current infrastructure capacity rather than consumer demand alone. With continued investment from providers such as InPost, Poste Italiane, and DPD BRT, OOH coverage is expected to increase steadily over the next few years, giving retailers broader flexibility in how they structure delivery choices and costs.
Pricing across delivery methods follows a clear hierarchy. Home delivery is the most expensive, with DHL and FedEx (TNT) positioned at the higher end in line with their express and international focus.GLS, Poste Italiane, and DPD BRT sit around the market average, reflecting large-scale domestic coverage and standardised pricing structures. InPost maintains the lowest price levels across OOH deliveries, consistent with its parcel-locker model and high network density.
The pricing gap between home and OOH - €6.5 vs €5.8 on average - highlights the economic rationale for providers to keep expanding out-of-home capacity, and in line with most other markets. As networks grow denser, these price differences will continue to influence retailer delivery mix.
Tembi’s analysis segments retailer clients by size and growth outlook, showing how each provider’s portfolio is positioned across the Italian market.
This chart summarises the average retailer size of each provider’s client base on Tembi’s 0–100 scale, where higher scores represent larger and more established webshops.
The stacked bars show how each delivery provider’s clients are distributed by retailer size:
Using Tembi’s forward-looking Growth Indicator - a composite of product portfolio development, traffic momentum, financial proxies, and export activity - InPost has the highest share of high- and very-high-growth retailers, reflecting its alignment with fast-scaling digital merchants. DHL also skews towards higher-growth segments, supported by its express and cross-border strengths. Meanwhile, GLS, Poste Italiane, and DPD BRT hold proportionally larger bases of mature retailers, providing stability and recurring parcel volume.
Locker and parcel shop networks are entering a phase of rapid expansion across Italy.InPost leads with more than 3,000 lockers installed at the start of 2025. DHL and Poste Italiane jointly reported around 500 lockers by mid-2025, alongside an ambitious plan to reach 10,000 units in the coming years. DPD BRT, through its Fermopoint network, aims for up to 4,000 lockers within five years, while GLS initiated its own rollout during 2025.
This coordinated investment places Italy on a clear multi-year OOH growth trajectory, reshaping how carriers balance cost, capacity, and customer reach. The build-out is not just a convenience upgrade; it’s a structural shift in network economics - each new locker or parcel shop reduces last-mile cost per parcel and expands delivery capacity in urban areas.
Why it matters
Rising locker and parcel shop density directly influences:
As the network matures, OOH will become a central component of Italy’s last-mile infrastructure, shaping both consumer choice and carrier efficiency.
Tembi’s analysis highlights three practical dimensions that matter for market strategy and portfolio alignment.
1. Segment by retailer size and category
Italy’s retailer landscape is dominated by small and medium merchants, but larger and premium-category retailers - such as fashion, beauty, and consumer electronics - set higher expectations for service speed, reliability, and returns. Delivery providers should align SLAs, OOH coverage, and returns management to match those standards while maintaining efficient access to the long tail.
2. Model the price–mix effect
With home delivery averaging €6.5 and OOH €5.8, even a modest shift in checkout mix can materially improve cost-to-serve for both carriers and retailers. Tracking these dynamics by category and region helps identify where OOH incentives or dynamic checkout sequencing can achieve measurable margin impact.
3. Track portfolio momentum
Provider client portfolios differ in growth exposure. InPost and DHL are more concentrated among high-growth retailers, while GLS, Poste Italiane, and DPD BRT anchor the market’s stable core. Monitoring these shifts over time helps providers balance predictable SMB volume with faster-growing digital retailers, ensuring coverage across both maturity extremes.
Italy’s last-mile market is broad, price-competitive, and evolving. Method economics continue to favour OOH expansion as networks densify; provider portfolios show divergent exposures across retailer size and growth; and the locker build-out marks a long-term structural transformation rather than a short-term initiative.
This Italian last-mile delivery market analysis outlines the market map and comparative signals needed to inform planning, benchmarking, and partnership strategies across the sector.
Download the full Italian market report or schedule a Tembi demo to see your competitive view updated continuously.
Delivery fees across the Nordics have followed clear seasonal patterns and strategic adjustments over the past two years. Drawing on data from over100,000 webshops in Sweden, Denmark, Finland, and Norway between Q1 2024 and Q32025, we track how average consumer delivery prices (in EUR) have shifted.
This analysis zooms in on the Q4 holiday peak, highlights country-specific behaviours, and compares delivery methods in urban areas - parcel lockers, pickup points, and home delivery. The aim is to show how webshops shape their pricing strategies and how these evolve through the year.
Seasonality is a defining feature of delivery pricing in the Nordics. Q4, the peak holiday quarter, typically brings stable or higher fees rather than discounts. In late 2024, Black Friday and Christmas did not lead to cheaper delivery - instead, many webshops kept prices firm or lifted them slightly.
· Sweden: average home delivery rose from €7.60 in Q3 2024 to €8.00 in Q4, the annual peak.
· Denmark: small increases, such as parcel shop delivery at €5.89 in Q4 versus €5.83 inQ3.
· Finland: parcel shop fees jumped by around 5% in Q4 2024.
· Norway: parcel box delivery peaked during the holiday quarter.
The pattern suggests that in high-demand Q4, retailers prioritise covering fulfilment costs over cutting fees - even when running heavy sales campaigns.
This shifts in Q1, when prices correct downward. After the holiday rush, many webshops reduced or normalised fees:
This Q1 softness reflects the post-holiday slowdown in demand and renewed competition to attract consumers during a quieter season.
Q4 2024 stands out as a high point for delivery fees in several markets, corroborating that peak season surcharges and fewer free-shipping promos were in effect. In fact, during Black Week (Black Friday 2024), retailers across Noridcs reduced the prevalence of free shipping by 4% compared to 2023, opting instead to set spend thresholds or promote premium paid options (source: ingrid.com). In other words, fewer orders enjoyed “free delivery” in Q4 2024, as merchants nudged customers toward paid faster delivery or order bundling.This strategic move helped protect margins during the holiday boom – and consumers generally went along, paying for delivery when the value (speed, convenience) was clear (source: ingrid.com). The seasonal insight here is that peak demand doesn’t equal cheaper shipping; if anything, many webshops use the period to upsell premium delivery or maintain prices, rather than offer blanket free shipping.
Moving through 2025, the Q2 and Q3 2025 data show an interesting reset. By summer 2025, average delivery charges in many categories fell back to or below their levels from the previous holiday season. This sets the stage for how Q4 2025 might play out – which we’ll discuss in a moment.
Each Nordic market shows distinct pricing dynamics, shaped by competition, consumer behaviour, and delivery costs.
Swedish webshops consistently post the lowest delivery fees in the region.In early 2024, prices were modest - around €4.20 for locker delivery and €7.50 for home delivery. These rose steadily through the year, with parcel box and parcel shop deliveries more than 20% higher by Q3/Q4. Home delivery peaked at €8.00 in Q42024, reflecting inflationary pressures and webshop/carriers passing higher rates on to consumers.
In 2025, the trend reversed. By Q3 2025, parcel shop delivery had dropped from €6.57 in Q4 2024 to €5.37 (an 18% decline),while home delivery eased back to €7.59. This points to intensifying competition, with Swedish retailers willing to cut delivery prices quickly to gain an edge.
Denmark’s delivery pricing remained stable through 2024, with parcel lockers and pickup points in the mid-€5 range and home delivery around €7.80–7.90. Even in Q4, increases were marginal- for example, parcel shop delivery at €5.89 in Q4 versus €5.83 in Q3.
The shift came in 2025. By Q3, parcel lockers averaged €5.00 and parcel shops €5.11 - 10–13% lower than the prior holiday season. Home delivery also dipped to €7.30 from €7.91 in Q4 2024. This gradual decline suggests Danish webshops began competing more actively on delivery price or carriers pressed the prices further down.
Finland remains the most expensive Nordic market for delivery - especially for home delivery. In 2024, Finnish shoppers paid €12–13 for home delivery, nearly double Sweden’s average. Out-of-home methods were also high at €7+. Prices climbed steadily through 2024, with parcel shops up 12% by Q4.
In 2025, home delivery crept even higher, peaking at €12.90 in Q2. But by Q3, parcel locker and shop fees had fallen sharply - down about 10% from Q2, back to early-2024 levels. Home delivery stabilised around€12.50.
Norway experienced the most pronounced swings. In 2024, home delivery peaked at €10.08 in Q2, while parcel lockers (€8.21) and parcel shops (€9.16) hit highs in Q3. Interestingly, Q4 home delivery was lower than earlier in the year at €9.55.
By 2025, Norwegian webshops had cut prices heavily, especially for out-of-home delivery. Parcel lockers fell from over €8in late 2024 to €6.64 by Q3 2025- a 20% year-on-year drop. Parcel shop delivery followed a similar pattern, down about €1.20 on average versus Q4 2024. Home delivery also eased slightly to €9.25 by Q3.
The widening price gap between home and pickup options suggests a deliberate push to shift volume to more cost-efficient methods. For carriers, Norway highlights how quickly competitive conditions can change - and the need to adjust pricing strategies in real time.
To summarize the country trends, Table 1 highlights how delivery fees in Q3 2025 compare to the last peak season (Q42024). Most markets saw notable declines in that period, especially for out-of-home deliveries:
Data clearly shows that out-of-home delivery is significantly cheaper for consumers in urban areas – a natural effect when carriers can deliver 5–10 times more parcels per driver compared with home delivery.
Parcel box (locker) delivery
· Cheapest option across all markets by 2025(~€5–6.5).
· Prices spiked in 2024 (e.g. Norway €6.6 → €8.3)but dropped back sharply in 2025.
· Volatility suggests retailers test price sensitivity, then reset as competition kicks in.
Parcel shop(pickup point) delivery
· Typically a few cents above lockers, but fell notably in 2025.
· Norway: from ~€9 in 2024 to €7.2 by Q3 2025.
· Pricing gap with home delivery widened, creating strong incentives for consumers to choose pickup.
Home delivery
· Premium service, consistently the most expensive.
· Held steady through 2024–25: ~€7.5 in SE/DK,~€9.3 in NO, ~€12.5 in FI.
· Only small price drops, with Sweden (-13% YoY)the exception.
· Discounts remain rare and tied to high order values.
Out-of-home delivery became cheaper in 2025, while home delivery kept its premium. This reflects a conscious decision: steer demand towards lockers and pickup points to cut last-mile costs and ease peak-season pressure. Black Week 2024 showed the effect in practice - locker usage rose by four percentage points and delivery times improved as shoppers embraced flexible collection (source: ingrid.com).
For logistics providers and retailers, aggressive pricing on out-of-home delivery seems to become a core lever: it nudges cost-conscious consumers, reduces operational strain, while keeping satisfaction high. But the gap has limits - home delivery still anchors convenience expectations and remains a profit lever. The real challenge is balance: keeping lockers and pickups highly attractive without eroding the value or accessibility of home delivery.
Collaboration between retailers and logistics providers is key here, ensuring service levels meet expectations as more customers choose out-of-home - seen clearly during Black Week, when lockers not only gained share but also delivered faster on average (source: ingrid.com).
To keep the forecast transparent, we applied a simple model: for each country × delivery method, we took the Q4-over-Q3 seasonal change from 2024 and applied that ratio to Q3 2025 levels. Where 2025 trended lower than 2024, we also include a conservative midpoint between Q3 2025 and that baseline.
· Parcel box(lockers): €5.6–6.0
· Parcel shop(pickup): €6.1–6.3
· Home delivery: €9.0–9.2
Seasonal lift from Q3 to Q4 looks modest. Home delivery remains the premium option, while lockers and parcel shops stay clearly cheaper.
· Sweden: home ~€8.0 (flat vs last year); parcel shop ~€5.3 and lockers ~€5.0 (well below last year).
· Denmark: home ~€7.4; parcel shop ~€5.2; lockers ~€5.1 (all lower than last year).
· Finland: home ~€12.5 (still high); parcel shop ~€7.3; lockers ~€6.4 (both down year-on-year).
· Norway: home ~€9.25 (slightly below last year); parcel shop ~€7.1; lockers ~€6.7 (~20%down year-on-year).
Nordic delivery prices have eased through 2025 after peaking in late 2024, especially for out-of-home options (parcel box and parcel shop). Applying last year’s Q4-over-Q3 seasonality to current Q3 levels points to only small Q4 uplifts: lockers and pickups remain the low-cost choices, while home delivery stays premium and broadly flat.
Country patterns matter. Sweden and Denmark have lower 2025 bases and limited room for Q4 increases. Finland remains structurally high - especially on home delivery - so stability is more likely than hikes. Norway has corrected sharply this year, with retailers continuing to nudge volume toward cheaper lockers and pickups.
The underlying pricing strategies are clear:
· Continued shift to out-of-home delivery. Lower pricing here is deliberate - directing volume away from costly home delivery and easing last-mile strain.
· Home delivery as a premium anchor. Price cuts are modest; competition is about service quality (slots, ETAs, first-attempt success) rather than cents.
· Seasonal resets. After Christmas, prices ease in Q1—a cycle webshops use to stay competitive in slower months.
Finally, weigh this outlook against external factors that can quickly shift the picture: capacity constraints and consumer sentiment. If sentiment weakens, retailers may lean harder on thresholds and targeted incentives.
Being listed in checkout is not the same as being chosen.
Across millions of webshops, delivery providers are technically present at checkout, but the way they are presented varies widely. Sometimes the carrier is not named at all due to white-label setups. Sometimes delivery methods are bundled or implicit. Often, delivery time is missing.
When that happens, consumers hesitate or default to another option. And as agentic e-commerce will partly move checkout decisions towards automation and agent-driven flows, delivery options that are not clearly defined are even more likely to be skipped.
This is the problem the Checkout score is built to address.
Checkout setups are qualitative by nature. For years, Tembi has monitored how delivery providers are presented in checkout across large numbers of webshops.
With the Checkout score, this insight is now summarised per webshop, making it easy for carriers to identify where their service is not clearly surfaced and what is missing. The result is a simple, comparable overview of checkout visibility across all monitored webshops.
The Checkout score is built from observable elements in the checkout flow. Each webshop is assessed on whether key delivery information is explicitly presented to the shopper.
By default, the score covers three core parameters:
Each webshop receives a simple score (for example 1/3 or 2/3) along with a qualitative label (low, medium, high), making it easy to interpret at a glance.
The aim is not to define a perfect checkout, but to enable consistent comparison across clients, markets, and competitors.
The Checkout score is designed to support commercial and strategic teams by making checkout presentation visible, comparable, and trackable.
Key Account Management
Leadership
Checkout setups change frequently. Delivery options are added, renamed, re-sorted, or removed.
What previously required manual review across individual webshops can now be monitored systematically and at scale.
The Checkout score is calculated continuously and shown alongside historical data, allowing teams to:
This turns checkout from a static snapshot into an operational signal.
Not all last-mile providers care about the same things.
The Checkout score is configurable, allowing teams to decide which elements should be included based on their commercial focus. In addition to the default parameters, optional elements such as environment-friendly delivery can be enabled where sustainability positioning or green sorting plays a commercial role.
When additional parameters are enabled, the score adapts automatically – for example moving from a 3-point to a 4-point model.
As checkout decisions increasingly become automated, delivery information needs to be machine-readable as well as understandable to humans.
If a delivery option is present but poorly defined – missing a named provider, a clear method, or delivery timing – it becomes harder for both consumers and agents to select it.
The Checkout score makes delivery presentation explicit, structured, and measurable across all monitored webshops.
And once it is measurable, it becomes something teams can actively improve – rather than guess at.

MIA is Tembi’s new agentic Market Intelligence Analyst for e-commerce: an AI-powered analyst that answers complex questions on e-commerce and last-mile delivery by analysing Tembi’s proprietary data from more than one million monitored webshops across Europe. It is built for commercial, strategy and product teams who need to see how markets, competitors and propositions are changing, without waiting for bespoke reports or building complex queries.
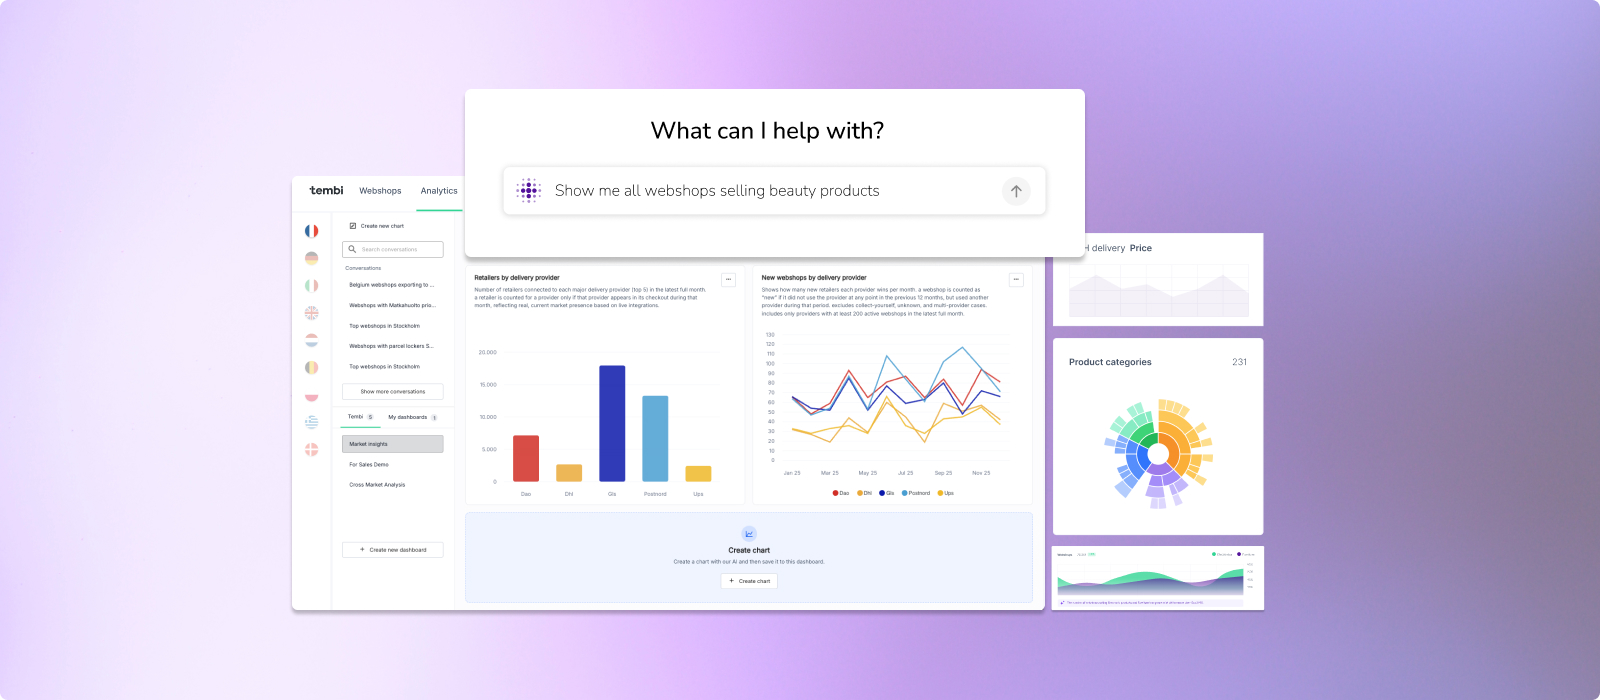
MIA turns Tembi’s market-scale e-commerce and last-mile data into something teams can interrogate in real time, not just receive in periodic reports. Instead of working around fixed dashboards, commercial, strategy and product teams can ask complex questions directly and see how markets, competitors and propositions are actually moving across Europe.
A typical workflow might start from a broad question like “Where have delivery propositions changed most in the last quarter?” and quickly narrow down to specific markets, segments or retailers. The analysis follows the question as it evolves, rather than forcing the question to fit a predefined view.
MIA acts like a market analyst orchestrated by a set of specialised AI agents that work directly on top of Tembi’s continuously monitored dataset of more than one million webshops across 23 European markets. When you ask a question, MIA is prompted with your query and an intent understanding agent interprets what you are really asking: the entities involved, the time horizon, the level of detail and the types of comparisons implied.

Based on that intent, MIA calls a data retrieval agent that knows how to navigate Tembi’s proprietary e-commerce and last-mile delivery data, select relevant retailers, markets, time periods and attributes, and assemble a fit-for-purpose dataset for the task. An analysis agent then applies appropriate methods – from simple aggregations and time series comparisons to mix shifts and provider presence views – and turns the results into structured outputs such as charts, graphs and allows users to build multi view dashboards that match the original question.
Throughout this process, MIA keeps the link between the analysis and the underlying data, so every result remains traceable back to specific retailers, webshops and time periods. If you need to validate or challenge a finding, you can move from an aggregate pattern (for example, “delivery options expanding in a given market”) down to the individual webshops that support that conclusion.
MIA follows the way analysts and commercial teams naturally work: start broad, refine, then package the results for others.
Read more about Agentic Analytics
MIA is possible because of Tembi’s underlying data foundation. Tembi continuously monitors more than one million European webshops and revisits each one roughly every two weeks to capture how assortments, brands, delivery methods, checkout setups and other attributes change over time.
That cadence turns e-commerce and last-mile delivery into a moving picture rather than a static snapshot. MIA brings an analyst layer on top of this, so instead of navigating raw complexity, teams can work with focused, question driven analysis that stays anchored in real, current market behaviour.
Explore an analysis of the Italian last-mile market done with MIA.
MIA is rolling out to selected Tembi customers from January 2026, with broader availability planned for March 2026. If your team works with e-commerce or last-mile delivery and wants analyst like access to Tembi’s market-scale data, you can register interest for early access on the MIA product page or by contacting Tembi at hello@tembi.io.
Interested in getting a demo, contact us and we'll set it up.
Spain counts 89,038 active online retailers, with clothes & shoes leading the category mix, an estimated +1,2bn parcels/year, and average delivery prices at €4,9 (home) vs €4,4 (OOH) for lightweight items. Our new Spain report maps the market structure, checkout dynamics, delivery methods, and how the main carriers compete for visibility - including the often-overlooked impact of white-label checkouts.
If you’re working in last-mile delivery and want a competitive view of Spain, download the full report here.
This report focuses on nine of the largest delivery providers in Spain: Correos / Correos Express, MRW, GLS, SEUR/DPD/Tipsa, DHL, NACEX, FedEx/TNT, CTT, and InPost/Mondial Relay. End-to-end retail & logistics operators (e.g., Amazon) and smaller/specialised operators (refrigerated, oversized, etc.) are intentionally excluded to keep the comparison clean and actionable.
All figures are based on Tembi’s continuous monitoring and analysis of Spanish online retailers and checkout setups, with consistent classification to support like-for-like analysis across markets. Use it to maintain competitive advantage, capture share in attractive segments, and understand market dynamics with clarity.
Quick takeaways
Spain is home to nearly 90,000 active online retailers, with a long tail that still produces meaningful parcel demand - and a smaller set of large/very large retailers that set service expectations (speed, returns, OOH availability, and delivery choice). Category-wise, Spain’s retailer base is led by clothes and shoes (~12,19%), followed by health & medicine (~7,04%) and beauty & personal care (~6,3%).
In Spain, share of presence (where a provider appears as an option in checkout) is heavily led by Correos / Correos Express, which shows up across ~41% of branded checkouts in our dataset, far ahead of the next tier (MRW, GLS, SEUR/DPD/Tipsa).
But presence is only half the story. In checkout, position matters.
Across Spanish webshops where delivery provider brands are visible, Correos / Correos Express holds the first position most frequently (33,1%), followed by GLS (20,9%) and SEUR / DPD / Tipsa (13,3%). MRW (11,2%) and NACEX (8,0%) follow, with DHL (5,8%) and smaller shares for others.
If you read our Italy last-mile delivery analysis, you’ll recognise the same core idea: the checkout is the battlefield. The winners aren’t only those with the biggest networks - they’re the providers most consistently prioritised where consumers actually make the choice - why checkout position and visibility are a key differentiators in revenue and brand building.
Here is the uncomfortable truth for last-mile brands: a large share of Spanish retailers don’t show carrier names at all - they show only delivery methods and prices.
This matters because it means “market share” can look very different depending on whether you measure parcel volumes, merchant relationships, or brand visibility to consumers. For carriers, improving brand exposure inside white-label environments is one of the largest untapped levers in Spain - because it’s not a network problem, it’s a checkout/integration problem.
Across the market, home delivery is still the default, and the regulator view aligns with what we see in retailer setups: CNMC reports that in 2024 the usual delivery place was home (68,9%), with PUDO/convenience points (13,6%) and lockers (3,8%).
When we look at delivery methods displayed across retailers (excluding white-label checkouts), the same story holds: OOH is present, but underbuilt - especially compared to where Spain could go given consumer density and the cost-to-serve logic that OOH enables.
And pricing reinforces the direction of travel: for lightweight items, average delivery prices are roughly €4,9 (home) vs €4,3–€4,5 (OOH) depending on parcel shop vs locker. Spain is also cheaper than Italy across all options, which changes the “room” carriers have to subsidise adoption - but not the underlying incentive to densify OOH.
While retailers set the price shown in checkout, these figures consistently reflect provider positioning.
Not all “presence” is equal. The value of a provider’s retailer base depends on who those retailers are.
Using Tembi’s size scoring (0–100), we can see clear portfolio skews:
Category exposure shows the same idea from a different angle: providers aren’t just “generalists” - each ends up with a distinct category footprint (e.g., stronger concentration in health & medicine, fashion, electronics, etc.)
Finally, our Growth Indicator model adds a forward-looking layer: DHL and InPost have the strongest growth-weighted portfolios, with 56% and 54% of their clients forecast to be in high or very high growth bands. Correos shows a more balanced mix across growth bands.
If you want the practical “so what” for Spain, three things stand out:
Spain’s last-mile market is large, competitive, and still structurally under-optimised in checkout. Correos dominates branded presence and first-position frequency, white-label checkouts hide a big part of the market, and OOH remains a clear runway - with meaningful differences in portfolio quality and growth potential across providers.
Download the full Spain report, or schedule a Tembi demo to see your competitive landscape updated continuously across markets - including comparisons to our Italy analysis
Italy counts 94,724 online retailers, with clothing, groceries and beauty leading the mix, average home delivery cost at €6.5 and OOH at €5.8. With continued investment and InPost’s strong market entry, OOH delivery is expanding rapidly and reshaping the competitive landscape. This Italian last-mile delivery market analysis maps the structure, methods and provider portfolios behind the numbers.
Working in last-mile delivery and interested in another competitive market analysis beyond Italy? Let's connect. Download the full report here.
Italy remains one of Europe’s most active e-commerce markets by merchant count and parcel flow. To help last-mile executives benchmark strategy, this report profiles the market composition, delivery method availability and pricing, and the competitive landscape across six core providers: GLS, Poste Italiane, DPD BRT, DHL, InPost, and FedEx (TNT). You’ll see where demand concentrates by category, how pricing positions each method, and how provider client portfolios skew by retailer size and expected growth.
All figures are derived from Tembi’s continuous monitoring and analysis of Italian online retailers and checkout setups, with consistent taxonomy and normalisation to support like-for-like comparisons. Use it to maintain competitive advantage, capture share in attractive segments, and understand market dynamics with clarity.
Quick takeaways
Italy’s 94,724-strong retailer base skews to clothes & shoes (≈12.1%), then food & groceries (≈6.7%), and beauty (≈5.4%). The size pyramid shows most merchants are medium, fewer large, and about 1% very large, indicating a wide long-tail with concentrated head accounts that influence parcel mix and service expectations. The latest available data from 2020 suggest that around 830 million parcels are shipped domestically each year. Given the latest e-commerce growth estimation of an average annual growth rate of 4.5%, parcel volumes could now be approaching one billion shipments.
GLS and Poste Italiane hold the broadest presence across Italian webshops - GLS appears in 48.7% of retailer checkouts and Poste Italiane in 46.3%. DPD BRT, DHL, InPost, and FedEx (TNT) follow, forming the rest of the competitive landscape.
When looking at the first delivery option offered to shoppers, GLS leads with roughly 30%, followed by DPD BRT (26%) and Poste Italiane (22%).This ordering pattern reflects how retailers prioritise providers based on network reach, reliability, and negotiated terms rather than pure visibility.
In short:
Across Italian retailers, home delivery remains dominant, offered by roughly 89% of webshops. Parcel shops (≈9%) and parcel lockers (≈3%) are still at an early stage of rollout, but both formats are expanding as networks and integrations mature.
The limited share of OOH options reflects the market’s current infrastructure capacity rather than consumer demand alone. With continued investment from providers such as InPost, Poste Italiane, and DPD BRT, OOH coverage is expected to increase steadily over the next few years, giving retailers broader flexibility in how they structure delivery choices and costs.
Pricing across delivery methods follows a clear hierarchy. Home delivery is the most expensive, with DHL and FedEx (TNT) positioned at the higher end in line with their express and international focus.GLS, Poste Italiane, and DPD BRT sit around the market average, reflecting large-scale domestic coverage and standardised pricing structures. InPost maintains the lowest price levels across OOH deliveries, consistent with its parcel-locker model and high network density.
The pricing gap between home and OOH - €6.5 vs €5.8 on average - highlights the economic rationale for providers to keep expanding out-of-home capacity, and in line with most other markets. As networks grow denser, these price differences will continue to influence retailer delivery mix.
Tembi’s analysis segments retailer clients by size and growth outlook, showing how each provider’s portfolio is positioned across the Italian market.
This chart summarises the average retailer size of each provider’s client base on Tembi’s 0–100 scale, where higher scores represent larger and more established webshops.
The stacked bars show how each delivery provider’s clients are distributed by retailer size:
Using Tembi’s forward-looking Growth Indicator - a composite of product portfolio development, traffic momentum, financial proxies, and export activity - InPost has the highest share of high- and very-high-growth retailers, reflecting its alignment with fast-scaling digital merchants. DHL also skews towards higher-growth segments, supported by its express and cross-border strengths. Meanwhile, GLS, Poste Italiane, and DPD BRT hold proportionally larger bases of mature retailers, providing stability and recurring parcel volume.
Locker and parcel shop networks are entering a phase of rapid expansion across Italy.InPost leads with more than 3,000 lockers installed at the start of 2025. DHL and Poste Italiane jointly reported around 500 lockers by mid-2025, alongside an ambitious plan to reach 10,000 units in the coming years. DPD BRT, through its Fermopoint network, aims for up to 4,000 lockers within five years, while GLS initiated its own rollout during 2025.
This coordinated investment places Italy on a clear multi-year OOH growth trajectory, reshaping how carriers balance cost, capacity, and customer reach. The build-out is not just a convenience upgrade; it’s a structural shift in network economics - each new locker or parcel shop reduces last-mile cost per parcel and expands delivery capacity in urban areas.
Why it matters
Rising locker and parcel shop density directly influences:
As the network matures, OOH will become a central component of Italy’s last-mile infrastructure, shaping both consumer choice and carrier efficiency.
Tembi’s analysis highlights three practical dimensions that matter for market strategy and portfolio alignment.
1. Segment by retailer size and category
Italy’s retailer landscape is dominated by small and medium merchants, but larger and premium-category retailers - such as fashion, beauty, and consumer electronics - set higher expectations for service speed, reliability, and returns. Delivery providers should align SLAs, OOH coverage, and returns management to match those standards while maintaining efficient access to the long tail.
2. Model the price–mix effect
With home delivery averaging €6.5 and OOH €5.8, even a modest shift in checkout mix can materially improve cost-to-serve for both carriers and retailers. Tracking these dynamics by category and region helps identify where OOH incentives or dynamic checkout sequencing can achieve measurable margin impact.
3. Track portfolio momentum
Provider client portfolios differ in growth exposure. InPost and DHL are more concentrated among high-growth retailers, while GLS, Poste Italiane, and DPD BRT anchor the market’s stable core. Monitoring these shifts over time helps providers balance predictable SMB volume with faster-growing digital retailers, ensuring coverage across both maturity extremes.
Italy’s last-mile market is broad, price-competitive, and evolving. Method economics continue to favour OOH expansion as networks densify; provider portfolios show divergent exposures across retailer size and growth; and the locker build-out marks a long-term structural transformation rather than a short-term initiative.
This Italian last-mile delivery market analysis outlines the market map and comparative signals needed to inform planning, benchmarking, and partnership strategies across the sector.
Download the full Italian market report or schedule a Tembi demo to see your competitive view updated continuously.
Delivery fees across the Nordics have followed clear seasonal patterns and strategic adjustments over the past two years. Drawing on data from over100,000 webshops in Sweden, Denmark, Finland, and Norway between Q1 2024 and Q32025, we track how average consumer delivery prices (in EUR) have shifted.
This analysis zooms in on the Q4 holiday peak, highlights country-specific behaviours, and compares delivery methods in urban areas - parcel lockers, pickup points, and home delivery. The aim is to show how webshops shape their pricing strategies and how these evolve through the year.
Seasonality is a defining feature of delivery pricing in the Nordics. Q4, the peak holiday quarter, typically brings stable or higher fees rather than discounts. In late 2024, Black Friday and Christmas did not lead to cheaper delivery - instead, many webshops kept prices firm or lifted them slightly.
· Sweden: average home delivery rose from €7.60 in Q3 2024 to €8.00 in Q4, the annual peak.
· Denmark: small increases, such as parcel shop delivery at €5.89 in Q4 versus €5.83 inQ3.
· Finland: parcel shop fees jumped by around 5% in Q4 2024.
· Norway: parcel box delivery peaked during the holiday quarter.
The pattern suggests that in high-demand Q4, retailers prioritise covering fulfilment costs over cutting fees - even when running heavy sales campaigns.
This shifts in Q1, when prices correct downward. After the holiday rush, many webshops reduced or normalised fees:
This Q1 softness reflects the post-holiday slowdown in demand and renewed competition to attract consumers during a quieter season.
Q4 2024 stands out as a high point for delivery fees in several markets, corroborating that peak season surcharges and fewer free-shipping promos were in effect. In fact, during Black Week (Black Friday 2024), retailers across Noridcs reduced the prevalence of free shipping by 4% compared to 2023, opting instead to set spend thresholds or promote premium paid options (source: ingrid.com). In other words, fewer orders enjoyed “free delivery” in Q4 2024, as merchants nudged customers toward paid faster delivery or order bundling.This strategic move helped protect margins during the holiday boom – and consumers generally went along, paying for delivery when the value (speed, convenience) was clear (source: ingrid.com). The seasonal insight here is that peak demand doesn’t equal cheaper shipping; if anything, many webshops use the period to upsell premium delivery or maintain prices, rather than offer blanket free shipping.
Moving through 2025, the Q2 and Q3 2025 data show an interesting reset. By summer 2025, average delivery charges in many categories fell back to or below their levels from the previous holiday season. This sets the stage for how Q4 2025 might play out – which we’ll discuss in a moment.
Each Nordic market shows distinct pricing dynamics, shaped by competition, consumer behaviour, and delivery costs.
Swedish webshops consistently post the lowest delivery fees in the region.In early 2024, prices were modest - around €4.20 for locker delivery and €7.50 for home delivery. These rose steadily through the year, with parcel box and parcel shop deliveries more than 20% higher by Q3/Q4. Home delivery peaked at €8.00 in Q42024, reflecting inflationary pressures and webshop/carriers passing higher rates on to consumers.
In 2025, the trend reversed. By Q3 2025, parcel shop delivery had dropped from €6.57 in Q4 2024 to €5.37 (an 18% decline),while home delivery eased back to €7.59. This points to intensifying competition, with Swedish retailers willing to cut delivery prices quickly to gain an edge.
Denmark’s delivery pricing remained stable through 2024, with parcel lockers and pickup points in the mid-€5 range and home delivery around €7.80–7.90. Even in Q4, increases were marginal- for example, parcel shop delivery at €5.89 in Q4 versus €5.83 in Q3.
The shift came in 2025. By Q3, parcel lockers averaged €5.00 and parcel shops €5.11 - 10–13% lower than the prior holiday season. Home delivery also dipped to €7.30 from €7.91 in Q4 2024. This gradual decline suggests Danish webshops began competing more actively on delivery price or carriers pressed the prices further down.
Finland remains the most expensive Nordic market for delivery - especially for home delivery. In 2024, Finnish shoppers paid €12–13 for home delivery, nearly double Sweden’s average. Out-of-home methods were also high at €7+. Prices climbed steadily through 2024, with parcel shops up 12% by Q4.
In 2025, home delivery crept even higher, peaking at €12.90 in Q2. But by Q3, parcel locker and shop fees had fallen sharply - down about 10% from Q2, back to early-2024 levels. Home delivery stabilised around€12.50.
Norway experienced the most pronounced swings. In 2024, home delivery peaked at €10.08 in Q2, while parcel lockers (€8.21) and parcel shops (€9.16) hit highs in Q3. Interestingly, Q4 home delivery was lower than earlier in the year at €9.55.
By 2025, Norwegian webshops had cut prices heavily, especially for out-of-home delivery. Parcel lockers fell from over €8in late 2024 to €6.64 by Q3 2025- a 20% year-on-year drop. Parcel shop delivery followed a similar pattern, down about €1.20 on average versus Q4 2024. Home delivery also eased slightly to €9.25 by Q3.
The widening price gap between home and pickup options suggests a deliberate push to shift volume to more cost-efficient methods. For carriers, Norway highlights how quickly competitive conditions can change - and the need to adjust pricing strategies in real time.
To summarize the country trends, Table 1 highlights how delivery fees in Q3 2025 compare to the last peak season (Q42024). Most markets saw notable declines in that period, especially for out-of-home deliveries:
Data clearly shows that out-of-home delivery is significantly cheaper for consumers in urban areas – a natural effect when carriers can deliver 5–10 times more parcels per driver compared with home delivery.
Parcel box (locker) delivery
· Cheapest option across all markets by 2025(~€5–6.5).
· Prices spiked in 2024 (e.g. Norway €6.6 → €8.3)but dropped back sharply in 2025.
· Volatility suggests retailers test price sensitivity, then reset as competition kicks in.
Parcel shop(pickup point) delivery
· Typically a few cents above lockers, but fell notably in 2025.
· Norway: from ~€9 in 2024 to €7.2 by Q3 2025.
· Pricing gap with home delivery widened, creating strong incentives for consumers to choose pickup.
Home delivery
· Premium service, consistently the most expensive.
· Held steady through 2024–25: ~€7.5 in SE/DK,~€9.3 in NO, ~€12.5 in FI.
· Only small price drops, with Sweden (-13% YoY)the exception.
· Discounts remain rare and tied to high order values.
Out-of-home delivery became cheaper in 2025, while home delivery kept its premium. This reflects a conscious decision: steer demand towards lockers and pickup points to cut last-mile costs and ease peak-season pressure. Black Week 2024 showed the effect in practice - locker usage rose by four percentage points and delivery times improved as shoppers embraced flexible collection (source: ingrid.com).
For logistics providers and retailers, aggressive pricing on out-of-home delivery seems to become a core lever: it nudges cost-conscious consumers, reduces operational strain, while keeping satisfaction high. But the gap has limits - home delivery still anchors convenience expectations and remains a profit lever. The real challenge is balance: keeping lockers and pickups highly attractive without eroding the value or accessibility of home delivery.
Collaboration between retailers and logistics providers is key here, ensuring service levels meet expectations as more customers choose out-of-home - seen clearly during Black Week, when lockers not only gained share but also delivered faster on average (source: ingrid.com).
To keep the forecast transparent, we applied a simple model: for each country × delivery method, we took the Q4-over-Q3 seasonal change from 2024 and applied that ratio to Q3 2025 levels. Where 2025 trended lower than 2024, we also include a conservative midpoint between Q3 2025 and that baseline.
· Parcel box(lockers): €5.6–6.0
· Parcel shop(pickup): €6.1–6.3
· Home delivery: €9.0–9.2
Seasonal lift from Q3 to Q4 looks modest. Home delivery remains the premium option, while lockers and parcel shops stay clearly cheaper.
· Sweden: home ~€8.0 (flat vs last year); parcel shop ~€5.3 and lockers ~€5.0 (well below last year).
· Denmark: home ~€7.4; parcel shop ~€5.2; lockers ~€5.1 (all lower than last year).
· Finland: home ~€12.5 (still high); parcel shop ~€7.3; lockers ~€6.4 (both down year-on-year).
· Norway: home ~€9.25 (slightly below last year); parcel shop ~€7.1; lockers ~€6.7 (~20%down year-on-year).
Nordic delivery prices have eased through 2025 after peaking in late 2024, especially for out-of-home options (parcel box and parcel shop). Applying last year’s Q4-over-Q3 seasonality to current Q3 levels points to only small Q4 uplifts: lockers and pickups remain the low-cost choices, while home delivery stays premium and broadly flat.
Country patterns matter. Sweden and Denmark have lower 2025 bases and limited room for Q4 increases. Finland remains structurally high - especially on home delivery - so stability is more likely than hikes. Norway has corrected sharply this year, with retailers continuing to nudge volume toward cheaper lockers and pickups.
The underlying pricing strategies are clear:
· Continued shift to out-of-home delivery. Lower pricing here is deliberate - directing volume away from costly home delivery and easing last-mile strain.
· Home delivery as a premium anchor. Price cuts are modest; competition is about service quality (slots, ETAs, first-attempt success) rather than cents.
· Seasonal resets. After Christmas, prices ease in Q1—a cycle webshops use to stay competitive in slower months.
Finally, weigh this outlook against external factors that can quickly shift the picture: capacity constraints and consumer sentiment. If sentiment weakens, retailers may lean harder on thresholds and targeted incentives.
For most companies, two questions matter when looking at the e-commerce market: which webshops will grow and how large they are today. These are not easy to answer. Financial accounts are published once a year and often with long delays. Website traffic tools vary in accuracy. Sales input can be useful, but it is not consistent across markets.
Tembi approaches the problem differently. We track over 800.000 webshops in 22 European markets, visiting them every two weeks, and we convert that activity into a clear view of current size and likely growth.
From this data, we produce two measures.
Together, these outputs give a comparable and timely view of the market that has not been available before.
What makes this possible is the breadth of signals we collect. Every webshop is assessed on seven main areas:
It is the combination of these factors, updated every two weeks, that produces a reliable picture of both size and growth.
Older approaches depend on delayed filings, unstable traffic estimates, or anecdotal sales input. They describe the past, not the present. By contrast, Tembi provides a structured, repeatable model that updates with the market itself. A Danish fashion webshop and a Spanish electronics retailer can be measured on the same scale, and shifts in momentum can be detected months before they appear in official reports.
This is not prediction for prediction’s sake. It is about replacing guesswork with evidence that is current, structured and comparable.
Tembi provides a way to see the market as it develops — which webshops are growing, how large they are, and where categories are shifting. It offers the clarity needed to make decisions with confidence, based on how the market is moving today.
Growth predictions and Size estimation are available on all markets Tembi has been active on for more then three months.
Knowing which webshops to focus on helps your business succeed. That’s why we've launched Tembi’s Size indication, a simple way to quickly understand how active and big (or small) any webshop is in the market compared to the largest online retailers.
What is the Size indication?
Tembi’s Size indications scores webshops from 1 to 100 points, dividing them into clear groups:
This makes it easy to compare webshops and see where they stand compared to others.
How does it work?
The Size indication uses hundreds of data points per webshop to decide each webshop’s score, including:
These factors, and many more, provide a clear picture of how active and large a webshop is. Each webshop’s score is clearly explained, showing both positive and negative factors.
Why the Size indication is useful
The Size indication makes market analysis simpler. You can quickly assess market size and find webshops that fit your ICP. When looking at thousands of prospects, Size indication allows you to sort all webshops, and see their size in relation to each other.
Combine Size indication with Growth Predictions
Tembi’s Size indication works hand-in-hand with our Growth Predictions feature. By combining these insights, you get a complete view of the market opportunity - clearly identifying which webshops are not only large and active but also likely to grow. This powerful combination helps you pinpoint the best opportunities for strategic action and growth.
Want to get started?
Log in to Tembi and check out the Size indication now. All Tembi clients have access to our Growth predictions and Size indication for free during July.
In business, knowledge is power, but foresight is transformational. Until now, most market intelligence relies on delivered reactive insights, offering clarity on the past or present but limited visibility into the future. Today, Tembi changes that by launching a groundbreaking predictive feature for e-commerce: Growth Predictions.
Why predictions matter
Understanding past performance is essential, but knowing what's coming next is where you truly gain a competitive advantage. With Growth Predictions, Tembi analyses hundreds of critical factors across hundreds of thousands of webshops, giving you a clear view of each retailer’s potential growth over the next 3 to 6 months.
How does it work?
Our unique predictive model evaluates comprehensive data points, including:
At the heart of this model is our proprietary AI-powered data collection methodology. For several years, we've meticulously collected, structured, and continuously updated vast datasets. Our advanced machine-learning algorithms use this rich historical data to identify patterns, learn from past behaviours, and generate precise, data-backed predictions. This ensures that our Growth Predictions aren’t guesses - they're calculated insights driven by robust AI techniques.
We translate these complex signals into straightforward, actionable insights, predicting whether a webshop will experience high growth, stability, or potential decline.
Transparent insights for smarter decisions
Growth Predictions don't just give you a simple score. They explain precisely why we anticipate certain growth patterns. For example:
This transparency helps you quickly understand the underlying strengths or vulnerabilities of any webshop.
Transform your commercial strategies
If you’re responsible for partnerships, sales, or logistics, Growth Predictions become your secret weapon. Prioritise your efforts, target the right segments and customers, optimise your resources, and proactively manage your commercial relationships by focusing on webshops that have a higher likeability to succeed.
First of its kind
No other e-commerce intelligence tool provides predictive growth insights at this depth. Using our unique dataset of retailers and product portfolios, we provide a comprehensive mapping of the e-commerce industry, helping companies plan strategically.
We update our dataset bi-weekly, ensuring teams can track prospects, provide insights and get a competitive advantage.
Interested in knowing more, book a demo with one of our experts.
Growth predictions are available for free as an early release during July for all our clients.
The retail industry is in the midst of profound transformation driven by two interconnected forces: the convergence of retail and e-commerce into a hybrid landscape, and the rapid integration of Artificial Intelligence (AI). These forces aren't just altering shopping habits - they're reshaping the entire retail value chain from manufacturing to fulfilment. McKinsey identifies these as key economic game-changers (putting aside broader geopolitical factors).
E-commerce has evolved beyond a simple digital channel into three overlapping segments:
• Manufacturers going Direct-to-Consumer (DTC): Brands like Nike, Zara, and Dyson build direct customer relationships through digital storefronts and direct shipments.
• Pure-Play digital platforms: Born-digital platforms like Zalando and ASOS innovate with personalisation and logistics, with some even branching into physical flagship stores.
• Traditional retailers adopting digital: Giants like IKEA and Walmart are integrating physical and digital experiences seamlessly.
These segments are merging into a highly competitive ecosystem where agility and market intelligence are essential. This blending doesn't simplify competition - it intensifies it, demanding constant vigilance and adaptability.
AI has moved from futuristic concept to operational necessity. Retailers leverage AI for personalised recommendations, dynamic pricing, predictive inventory management, and customer service automation, enabling smarter, faster, and more profitable operations.
Additionally, the expansion of cloud computing and the explosion of available data provide new opportunities to understand market dynamics in real-time. Historically, analysing every shelf in Europe was unthinkable; today, online data combined with AI makes large-scale, real-time market analysis entirely feasible.
A strategic framework for AI-enabled retail
Staying ahead requires a structured approach. Recently, Shish Shridhar from our partner Microsoft shared a strategic framework leveraging real-time data, AI, and automation, highlighting essential levers to drive growth.
Place – Sales channels: physical, digital, hybrid
Product – Assortment depth, availability
Value – Pricing strategy, perceived customer value
People – Customer service, store experience
Communication – Marketing, promotions, loyalty programmes
Systems – Technology infrastructure, analytics, automation
Logistics – Efficient supply chain, fulfilment methods, delivery
Suppliers – Vendor management, sourcing and COGS
At Tembi, we equip retailers and brands with large-scale market analytics derived from real-time data. We continuously track over 600,000 online retailers and 300 million products across Europe - among the largest datasets in the industry. By connecting this data with location specifics, company details, and AI-powered analytics, commercial teams gain clarity and confidence in decision-making, eliminating guesswork when it comes to understanding what drives growth.
As I see it, by unifying data across digital and physical touch points, market intelligence at scale enables smarter decisions in Product, Value, and Systems - helping businesses thrive in a hybrid, AI-first retail world.
• Based on the product categories that you excel in - which markets are then optimal, and in which geographies would it be optimal to promote and sell your products.
• If you have or plan to set up physical stores how are they threatened and compared to online retailers, and how is the specific area you think about investing in evolving. This will show whether you can expect optimal levels for sales per store and store traffic.
• Predict which product categories and brands to invest in, when you decide where to play - which product segments are you in with which brand and pricing strategies to drive market share and inventory turnover and hence sales growth.
• Understand the competition in the product categories and brands you are in and the strengths and strategies of the other players in the market.
Improve out-of stock-rate by finding out when products are sold over the year and if that differs in different geographies, and thereby make sure that availability is secured.
• Understand the current (or seasonality-defined) pricing in the market to increase gross margin, right-in-time markdowns, and possibility for price skimming but get an actual X-ray about the real price development in the market.
• When being present in the market, or especially entering a new one, you need to know how to make it successful. One of the important things to understand delivery market standards in different markets, e.g. OOH, home delivery, free shipping thresholds, delivery time etc. Some D2C try to negotiate a pan-European delivery contract without factoring ion the different market dynamics, or simply enter with the wrong expectations. This quickly becomes very expensive - e.g. if the customers are used to home deliveries and you go in the market wth parcel boxes, you would need to wait for that to be changed. Hence, very important to understand if you model fits to assure fulfilment accuracy.
Success in modern retail isn’t about choosing between physical and digital - it’s about blending them intelligently. In the era defined by AI and hybrid commerce, tools like Tembi provide retailers the crucial insights required to navigate complexity.
Whether you’re a DTC manufacturer, a digital-first retailer expanding your reach, or a traditional retailer enhancing your omnichannel strategy, winning demands strategic clarity grounded in data and real-time market intelligence.
How a Last-Mile delivery commercial team used Tembi to reach online retailers when they were most likely to engage.
A last mile delivery provider was looking to improve how and when they approached new merchant prospects. While they had a solid understanding of who they wanted to work with, outreach often happened too early (before the merchant was ready to switch) or too late (after a competitor had locked in a contract).
Without visibility into what was changing in the merchant’s checkout, reps had to rely on cold outreach, hoping to catch a merchant at the right moment. They needed a way to:
Using Tembi Checkout Intelligence, the team started monitoring live changes in merchant checkout configurations. Tembi scrapers simulate checkout flows on thousands of webshops and detect:
The team set up biweekly alerts on merchants that matched their ICP and showed recent changes in their delivery stack. This created a dynamic feed of prospects likely to be re-evaluating logistics partners, so an ideal timing for outreach.
The team didn’t need to chase every webshop in a market. Instead, they focused on high-potential accounts showing signs of change. Over a six-week period, they:
Timing their approach based on real signals helped them avoid wasted effort and start conversations when interest was highest.
✅ Actionable timing signals was more effective than cold outreach
✅ Changes tracked automatically from actual checkout flows
✅ Focus on merchants in motion who are more likely to convert
✅ Fewer dead ends - reps only acted when there was a reason to reach out
A last mile delivery provider operating across several European countries needed to give its regional sales & partnerships team a clearer picture of how competing providers were positioned locally. Without reliable data, the team depended on anecdotal feedback from merchants or patchy CRM notes about which providers were in use. This made it difficult to:
• Prepare for calls with accurate competitor insight
• Spot new merchant opportunities based on delivery gaps
• Build region-specific messaging around speed, tracking, or price
They weren’t seeking a broad market expansion strategy, just precise, local visibility to sharpen commercial conversations.
Using Tembi Checkout Intelligence, the team pulled data on hundreds of webshops in their target region. Tembi’s technology visits every retailer with an active webshop and creates visibility into checkout flows and extracts structured data on:
• Which delivery providers are actually offered
• Delivery speeds and prices
• Labels and methods (e.g. express, standard, tracked) in use
• Recent changes - such as a provider being added or removed
• Images of how delivery options were presented
The data, updated every two weeks, enabled quick filtering by platform (e.g. Shopify, WooCommerce), product category, and country/area. Local sales teams gained a trusted, up-to-date view of the real delivery landscape.
With provider usage clearly mapped for their target region, the team could:
• Enter sales calls with confidence, knowing which competitor was in place
• Spot merchants lacking tracked or fast delivery options
• Tailor outreach to emphasise service gaps (e.g. slow delivery, high fees)
• Build target lists of merchants using weaker providers for displacement opportunities
No major strategic shift - just sharper conversations, better timing, and stronger commercial positioning at the local level. With a 20% increase in conversion.
• Data based on real checkout flows - not assumptions or outdated lists
• Biweekly updates kept teams working with fresh information
• Easy filtering by region and platform enabled targeted, local action
• Directly supported pre-call research, personalised outreach, and competitive mapping
Interested in exploring how Checkout Data and Webshop Monitoring can help you grow your sales? Book a call with one of our Last-mile data experts. Book a demo
Today we’re rolling out Product Insights – a new tool that instantly breaks down the product catalogue of almost any webshop. By continuously monitoring 600,000 webshops and over 300 million products, Product Insights helps users find answers to questions that used to take days of manual work.

Understanding a retailer's product portfolio has always been a challenge – especially at scale. Tembi’s Product Insights structures each webshop’s catalogue based on Google’s product taxonomy (with over 2,000 sub-categories). Select a category, explore which sub-categories are sold, and get a clear view of the retailer’s product strategy.
Product Insights also lets you track trends over time. What categories are growing? Which brands are expanding? What product types are being phased out? With bi-weekly updates, your market understanding becomes sharper, faster, and far more granular than ever before.

See exactly which brands a webshop sells, the total number of SKUs, and how they’re distributed across product categories. Our time-series view lets you pinpoint when a retailer expands or trims its range – whether that means adding 50 new kitchen appliances in March or dropping three footwear brands in May. Drill down by category or brand to understand growth spurts, assortment gaps, and strategic shifts at a glance.


Visualise a webshop’s entire catalogue by weight and dimensions in one interactive chart. The horizontal axis splits product prices into six bands; the vertical axis divides weights into six ranges. Each bubble’s size shows how many items fall into that combined bracket.

Go beyond individual retailers and tap into broader market movements. With Product Insights, you can zoom out and analyse how categories, brands, and product types are evolving across the entire e-commerce landscape in Europe (18 markets).
See which product categories are gaining momentum, what brands are expanding their reach, and how average product sizes or prices are shifting. Filter by country, industry or platform to spot changes in consumer demand, pricing trends, or assortment strategies.
Whether you're a brand manager trying to spot gaps, a logistics provider tracking shipping implications, or a buyer evaluating sourcing decisions – Product Insights turns market noise into clear, structured signals.
Instantly compare any retailer with others and uncover new prospects. Tembi’s Similar Webshops feature identifies other webshops with matching assortment structures, traffic levels, and category focus.

It’s a fast way to benchmark a client against competitors – or to find high-potential leads you might otherwise miss. Want to compare delivery providers across similar stores? Or find out how two apparel retailers differ in average price point and category spread? Just click “Full comparison” and dive into the details.
You can also scan for rising players in your segment. Use Similar Webshops to uncover up-and-coming stores with fast-growing assortments – perfect for partnership, outreach, or competitive monitoring.
Product Insights is available now on Tembi. Whether you're tracking competitors, mapping out market shifts or sourcing prospects – the data you need is finally structured, searchable, and updated every two weeks.
Want to know more? Book a demo today!
When starting an online store, businesses can either build a custom site from scratch or choose a ready-made e-commerce platform to manage their online sales. Over the years, a variety of commerce platforms have emerged - from large international solutions like Shopify and WooCommerce to smaller local specialists such as Dandomain in Denmark or Voog in Estonia. Choosing the right platform is a crucial decision not only for merchants, but also for the ecosystem of plug-in developers and service providers around these platforms. Not all add-ons work with every framework, so understanding a platform’s market penetration in each region is key to gauging its success and where to invest resources.

In this article, we take a data-driven look at the most widely used e-commerce platforms across selected European countries. The analysis spans 17 markets (Belgium, Bulgaria, Switzerland, Germany, Denmark, Estonia, Finland, Hungary, Iceland, Italy, Lithuania, Latvia, the Netherlands, Norway, Romania, Sweden, and Slovakia), covering a total of over 600,000 active webshops (online stores) identified in these countries. The findings confirm that two platforms dominate the landscape: WooCommerce - the open-source plugin for WordPress - and Shopify - the popular SaaS commerce platform. Together, these two power roughly 70-73% of all identified webshops in these markets. WooCommerce alone accounts for about 40% of the stores, making it the preferred solution overall, while Shopify powers around 30% of the stores, having rapidly grown in recent years. This duopoly leaves a long tail of other platforms sharing the remaining ~30% of the market. Nonetheless, those “other” platforms number in the tens of thousands of sites - for instance, over 15,000 webshops use PrestaShop and more than 13,000 use Magento across these countries - indicating significant niches and opportunities still exist beyond the top two.
It’s likely no surprise that Shopify and WooCommerce dominate across Europe’s e-commerce scene. But who are the other key players in each country, and how do platform preferences vary by market? Below, we break down the leading commerce platforms in each country, highlighting local trends, growth patterns, and the fit of certain platforms to regional needs.
Belgium has roughly 20,534 active e-commerce sites in total. The Belgian market is notable for being one of the few where Shopify takes the top spot in our analysis. About half of Belgian webshops (estimated 10,233 sites) are built on Shopify. The next most popular framework is WooCommerce with around 5,181 sites (about 25% share). Combined, Shopify and WooCommerce power roughly 75% of Belgium’s online stores. The remaining quarter is split among other platforms.
PrestaShop is the third most common, used by ~1.7k sites (~8%), followed by Magento (~1.1k sites, ~5%). Notably, Lightspeed - a platform known for its integrated point-of-sale and e-commerce (and which acquired a Dutch e-commerce provider - SEOshop - popular in Benelux) - powers around 765 Belgian webshops (~4%). This suggests a decent niche in Belgium for platforms that cater to omnichannel retail.
Overall, while global solutions lead in Belgium, a mix of mostly European platforms (PrestaShop, Lightspeed) make up the rest, indicating Belgian merchants have a range of mature solutions to choose from.
Bulgaria’s e-commerce market comprises around 8,554 - a smaller market where open-source solutions have a strong foothold. WooCommerce is the clear leader, used by roughly 4,625 Bulgarian online stores (over 54% of the total). The second place goes to OpenCart (about 1,507 sites, ~18%), an open-source platform historically popular in Eastern Europe. Shopify, which is second in many other countries, ranks third in Bulgaria with ~1.3k sites (around 15%). This suggests that many Bulgarian merchants favor self-hosted, cost-effective solutions (WooCommerce, OpenCart) over SaaS. PrestaShop is next with a few hundred sites (~304, ~3.5%), followed by Magento (267 sites). Local Bulgarian-specific platforms have a limited presence - for example, CloudCart (a Bulgarian e-commerce platform) appears further down with only a few dozen sites. In summary, Bulgaria’s platform distribution is dominated by WooCommerce and other open-source frameworks, likely due to their flexibility and low cost, while Shopify is present but not as dominant as elsewhere.
Switzerland is home to about 33,395 online shops. The Swiss e-commerce landscape is led by the same global players, but with a twist. WooCommerce is the most used platform here, powering roughly 12,168 webshops (around 45% of the market). Shopify follows closely with about 9,841 shops (~36% share). Together they account for over 80% of Swiss stores. The remaining ~19% of sites are on a long tail of other solutions.
PrestaShop is the third-ranking platform (about 1.5k sites, ~4-5%), and Magento comes next (~817 sites, ~2%). Shopware, a German-born platform, also has a modest presence (~554 sites) in Switzerland. One of the only notable local players is PepperShop, a Swiss e-commerce software; however, it accounts for only a few hundred stores (roughly 374 identified) - a relatively small 1% share.
In essence, Switzerland’s retailers gravitate strongly toward the big international platforms, and despite having local solutions like PepperShop, these haven’t gained major traction against WooCommerce and Shopify.
Germany’s large and mature e-commerce market (with around 133,860 webshops identified) has undergone a significant shift in recent years. Shopify has surged in popularity to become the number one e-commerce platform among German merchants, especially SMEs (cedcommerce.com). Our data shows about 57,000+ German online stores running on Shopify (roughly 42-43% of all German webshops). This marks a major change, as traditionally German-built solutions were dominant. Now, WooCommerce is in second place with about 32,000 sites (~24% share). Combined, these two account for roughly two-thirds of German stores. German-origin platforms still play an important role: Shopware - known for its robust, customizable platform - powers about 9,400 sites (~7%) in Germany. Another local contender is JTL-Shop, which along with Shopware caters to merchants needing advanced inventory and ERP integrations; JTL is used by ~4,000 stores (~3%) (and notably, JTL holds around 12% share in some analyses focused on SMB segment) (cedcommerce.com).
Magento and ePages (a SaaS platform often used by hosting providers in Europe) each are used by roughly 4-7k German stores (around 3-5% share each). Overall, the trend in Germany is clear: Shopify’s user-friendly interface and accessible pricing have propelled it past traditional German platforms (cedcommerce.com). Shopware and others remain relevant for businesses that require more localized support or complex customizations, but the ease of SaaS has won over many German SMEs. It’s also worth noting that custom-built e-commerce solutions (proprietary platforms) still exist in Germany - in fact, we can see that custom solutions account for close to half of e-commerce traffic in Germany - meaning many high-volume retailers use their own systems. By sheer number of sites, however, custom builds are only a small fraction (only ~2% of German stores in our count), as most companies choose established platforms.
Denmark has about 39,460 online stores in total. The Danish market is dominated by the two usual suspects: WooCommerce and Shopify. WooCommerce slightly leads with around 15,447 webshops, about 39% of the market. Shopify is a close second at roughly 14,689 stores (~37%). Combined, they power roughly 76% of Danish e-commerce sites - a very tight race between the open-source and SaaS approach. The remaining quarter of the market includes several platforms, notably a strong local player. Dandomain - a Denmark-based e-commerce platform - accounts for about 2,339 sites, making it the third most popular choice (~6% share). Dandomain’s local roots and integration with Danish hosting services likely contribute to its continued popularity in Denmark.
After that, we see Magento (~1.3k sites, 3%) and PrestaShop (~1.0k sites, ~2.5%) in the rankings. Additionally, Denmark has a few hundred webshops on Optimizely (formerly Episerver, a Swedish enterprise platform) and SmartWeb (a Danish SMB platform), reflecting that some Danish businesses opt for specialized solutions.
In summary, Denmark mirrors the broader trend of WooCommerce and Shopify dominance, with a notable chunk of merchants sticking to a home-grown solution (Dandomain) for its local advantages.
Estonia’s e-commerce scene, while small in absolute numbers (around 9,956 webshops total), is unique in having an extremely dominant #1 platform. WooCommerce is used by about 5,846 Estonian webshops - roughly 68% of the country’s online stores. This gives Estonia the distinction of the highest WooCommerce market share among the countries analyzed.
Shopify is a distant second with only 739 sites in Estonia (~9% share). In third place is a local platform: Voog, an Estonia-based website and commerce platform, which powers about 570 webshops (around 6% of the market). Voog offers native Estonian-language support and caters to small and mid-sized businesses, which explain its solid foothold despite WooCommerce’s dominance.
The remaining ~17% of Estonian stores are split among various other providers (about 1,800 stores in total). Aside from Voog, no other single platform has more than a few hundred sites in Estonia - for example, PrestaShop and OpenCart have a few hundred each, and there’s a long tail including Ecwid, Magento, and others.
In essence, Estonia is a case where one open-source solution (WooCommerce) completely outshines the competition, with local specialized services like Voog carving out a niche alongside it.
Finland has roughly 18,632 e-commerce sites in total. Like most Nordic markets, the top two platforms are WooCommerce and Shopify. WooCommerce is used by about 8,126 Finnish webshops (approximately 44% market share). Shopify is the second choice with around 4,835 sites. Combined, these two make up roughly 70% of Finland’s online stores.
The remaining 30% is quite fragmented. Notably, Finland has a higher proportion of custom-built stores than many other countries - about 5% of Finnish webshops are custom solutions (roughly 800+ sites). This reflects Finland’s strong tech culture and businesses opting for bespoke e-commerce solutions tailored to specific needs.
Among packaged platforms, a local contender MyCashFlow stands out as the third most popular in Finland. MyCashFlow powers about 1,327 Finnish webshops (~9% of the market). This platform is Finland-based and has likely gained trust for its local support and features, showing that domestic providers can hold their own niche.
After MyCashFlow and custom builds, other platforms in Finland include PrestaShop (~3% share) and Magento (just over 2%), plus smaller presences of Vilkas, Squarespace/Wix, and others. In summary, Finland’s e-commerce platform distribution is led by global platforms, but with a notable segment of merchants choosing local solutions or fully custom builds to leverage local expertise and meet specific requirements.
Hungary’s online retail market includes about 27,060 webshops. Unlike many Western European countries, Hungary’s top platforms after WooCommerce are local ones. WooCommerce is number one with roughly 12,605 stores (~47% share) - nearly half of all Hungarian e-shops run on WordPress. The second most popular platform is Unas, a Hungary-based e-commerce platform, used by around 4,605 stores (~17%). Close behind is Shoprenter (another Hungarian SaaS e-commerce solution) with about 3,611 stores (~13%). These local platforms have been long-standing options in Hungary, offering Hungarian language support and local integrations (payments, delivery) which likely contribute to their significant uptake.
Shopify comes in fourth place in Hungary with roughly 2,511 stores (~9%), indicating that the global SaaS giant lags behind the domestic services here. Other platforms collectively make up the remaining ~14% of the market - for instance, OpenCart (around 989 sites, ~3.7%), Magento (~578 sites, ~2%), and a variety of smaller solutions including Shopware, PrestaShop, and some Romanian/Central European platforms that show minor presence (e.g. Shoptet, a Czech platform, appears with a few hundred Hungarian shops).
The Hungarian case underlines how local e-commerce providers can capture a large portion of the market by catering to regional needs (language, local logistics), even as global platforms are available.
Iceland’s e-commerce sector is the smallest in this group - we identified roughly 1,712 online stores in Iceland. Interestingly, Shopify absolutely dominates this tiny market. Approximately 1,169 Icelandic webshops run on Shopify, which is about 68% of all online stores in the country. This is one of the highest national market shares for Shopify among the countries examined. WooCommerce is the second most common, with around 507 stores (~30%).
Combined, Shopify and WooCommerce account for an astonishing ~98% of Iceland’s e-commerce sites - essentially a duopoly. This leaves very little room for other platforms: the third-place contender (far behind) is Magento, with only about 16 identified sites (<1%). A handful of stores use OpenCart (a dozen sites) or PrestaShop (just 4 sites).
The overwhelming preference for Shopify in Iceland could be due to the lack of any local e-commerce solution and the appeal of an easy-to-deploy, cloud-based platform for a small market. Additionally, many Icelandic businesses likely cater to international audiences or use English online, making a globally-oriented platform like Shopify a natural choice.
In summary, Iceland’s platform landscape is an outlier: Shopify is nearly synonymous with e-commerce here, with WooCommerce capturing most of the remainder and virtually no other platform having any significant footprint.
Italy has an estimated 72,334 active webshops in this analysis. The Italian e-commerce platform distribution skews heavily towards WooCommerce. WooCommerce is used by roughly 39,852 Italian online stores, about 55% of the total. This aligns with WooCommerce’s popularity among small-to-medium businesses in many European countries. Shopify is the second most used platform in Italy, powering about 17,804 stores (~24-25% share). Together, WooCommerce and Shopify make up nearly 80% of Italy’s e-commerce sites.
In third place is PrestaShop, which has a strong user base in Italy (around 6,349 stores, roughly 9% share). PrestaShop’s open-source platform, originally from France.. Beyond the top three, no single platform has more than a single-digit percentage of share. Custom-built solutions account for around 2-3% (we identified ~2,061 custom sites) indicating some companies opt for fully bespoke stores.
Magento, once a leading platform for mid-sized and enterprise merchants, now powers only about 1,938 Italian stores (~2.7%) - showing a decline in relative popularity as easier solutions have gained ground. Other platforms in Italy include smaller counts of OpenCart, Wix (for simpler websites with stores), and local SaaS offerings (though none of the local Italian platforms stand out in the data - the market seems largely served by international or open-source solutions).
In summary, Italy leans strongly on WooCommerce for a majority of shops, with Shopify as a robust second choice and PrestaShop still holding a notable third-place share. This suggests a mix of merchants: many favoring WooCommerce for its low cost and WordPress integration, and a significant group opting for Shopify’s simplicity, while an older guard or specific segment continues with PrestaShop and Magento.
Lithuania’s e-commerce market, with about 14,604 webshops, also shows a strong preference for WooCommerce. Around 7,983 Lithuanian online stores (about 55%) are built on WooCommerce, making it the dominant platform by far. Shopify is the second most popular, used by roughly 2,734 stores (~19% share). Combined, these two make up roughly 74% of the Lithuanian market, similar to other countries.
However, Lithuania has a more notable third-place presence than some others: PrestaShop powers about 1,706 stores (~12% of the market). In fact, PrestaShop is not far behind Shopify here - 12% vs 18% - showing that PrestaShop remains a viable choice for many Lithuanian merchants.
After PrestaShop, the remaining ~15% of sites are on a mix of platforms. OpenCart is fairly common (around 1,052 stores, ~7%) and there is a long tail of small platforms and custom sites. Notably, two Lithuanian-developed e-commerce platforms, Shopiteka and Verskis, appear in the data - but they rank among the smaller players, together accounting for only a couple hundred stores. For instance, Verskis is used by fewer than 100 sites (only ~96 identified), and Shopiteka similarly under 100. This indicates that, unlike some other Eastern European markets, local Lithuanian solutions haven’t achieved high popularity against the global and open-source options.
Overall, Lithuanian e-commerce is heavily reliant on WooCommerce’s ecosystem, with a significant minority on Shopify and a continued loyal user base on PrestaShop - reflecting perhaps the influence of neighboring Poland/Europe where PrestaShop is stronger, and the needs of merchants who prefer an open-source but more standalone platform than WooCommerce.
Latvia has approximately 6,049 online stores in the database. The platform distribution in Latvia is a bit more balanced at the top than in Lithuania or Estonia, but WooCommerce still leads. Around 1,841 Latvian webshops use WooCommerce, making up about 37% of the market. Shopify is the second most common at about 1,201 stores (~24% share). Together, they account for roughly 61% of Latvian online shops.
The remaining 39% is divided among various other platforms. One notable aspect of Latvia is the significant use of other solutions: OpenCart is the third-largest platform with roughly 713 sites (~12%) based on our data. Following that, a considerable number of sites are custom-built (~471 sites, ~8%), indicating a chunk of merchants opt for tailor-made solutions. PrestaShop comes next with about 333 stores (~5.5%).
Latvia also has its own local website builder/e-commerce tool named Mozello, which appears to power around 270 stores (around 4-5% of the market) - a non-trivial share for a local platform. Mozello offers easy bilingual site creation (useful in Latvia’s multilingual environment), which might explain its uptake.
All other platforms (Magento, Ecwid, etc.) each account for only a few percent or less. The data suggests that while WooCommerce and Shopify are very important in Latvia, a large minority of merchants use a mix of open-source, custom, or regional tools, making it a more diverse platform ecosystem in relative terms (nearly 40% using “other” platforms beyond the big two).
The Netherlands boasts a highly developed e-commerce market, with about 112,906 webshops counted in this analysis. Dutch online retailers have a clear favourite: WooCommerce. We found roughly 38,316 Dutch webshops using WooCommerce, which is about 46% of all online shops in the Netherlands. This aligns with other findings that WooCommerce has a very strong presence in the Dutch market. Shopify is the second-largest platform with around 21,534 stores (~26% share). Together, WooCommerce and Shopify account for approximately 72% of the market, leaving just over a quarter of sites on other platforms.
The Netherlands has a diverse mix of other e-commerce solutions making up that remaining ~27%. One notable player is Optimizely (formerly Episerver Commerce), an enterprise-level platform - about 7,928 Dutch sites (~7%) use Optimizely. This is a significant share and suggests many mid-to-large Dutch businesses invest in enterprise .NET-based solutions (possibly thanks to a robust ecosystem of agencies for Optimizely in the region).
Magento is also present, with around 6,176 sites (~5.5%). The Dutch market also continues to support Lightspeed (formerly SEOshop in Europe) with roughly 3,820 sites (~3.4%). Lightspeed’s continued use is expected given its local origins and focus on omnichannel retailers (brick-and-mortar stores integrating online). Additionally, a homegrown platform MyOnlineStore (also known as JouwWeb) powers about 3,600 shops (a little over 3%). Other platforms in the Netherlands include PrestaShop, Wix, Shopware, and custom builds, but each of those represents only 2-3% or less.
The key takeaway is that the Dutch e-commerce environment is heavily weighted toward WooCommerce for smaller businesses and content-driven stores, with Shopify catching up for pure-play online merchants, while a substantial segment of more complex or established retailers opt for enterprise or locally tailored solutions like Optimizely and Lightspeed.
Norway’s e-commerce market includes around 17,316 webshops. The competition between WooCommerce and Shopify is particularly tight in Norway. WooCommerce is used by roughly 5,346 Norwegian webshops (39% share). Shopify is a very close second with about 4,931 sites (36% share). That’s a gap of only a few hundred sites, or about 3 percentage points, in WooCommerce’s favour. This near parity shows how strongly Shopify has gained traction even in markets traditionally dominated by open-source solutions.
The remaining ~24% of Norwegian webshops (about 3,192 sites) run on various other providers. Norway has a couple of notable local platforms in this “others” category. MyStore, a Norwegian-founded e-commerce platform, is the third most popular choice with about 1,071 sites (~6% share). MyStore’s presence indicates that some Norwegian merchants prefer a domestic solution, possibly for its local language support and integration with Norwegian payment or logistics options. Another Norwegian platform 24Nettbutikk accounts for around 701 sites (~4%), making it the fourth-ranked platform.
After these, the rest is fragmented: Magento has a few hundred sites (~2.7%), and there are many small contributions from others like Wix, WooCommerce’s forked variants, etc. The Norwegian e-commerce platform landscape can be summarized as a neck-and-neck race between the top global two, with local players carving out around 10% of the market combined (not insignificant for a country of Norway’s size). The close competition also suggests that platform choice in Norway might come down to specific business preferences - WooCommerce for content flexibility or existing WordPress usage, versus Shopify for ease of use - rather than clear-cut market leader advantage.
Romania’s e-commerce market (approximately 31,892 webshops) shows a strong lead for WooCommerce as well, with some influence of local platforms. WooCommerce is estimated to power about 17,262 Romanian online stores, which is roughly 54% of the total. This is a majority share, indicating WooCommerce’s popularity among Romanian merchants, likely due to its low cost and flexibility in a price-sensitive market. The second most popular platform is Shopify, used by around 5,396 stores (~17%). Shopify’s share in Romania, while significant, is lower than in many Western countries.
The third place goes to PrestaShop with roughly 2,327 stores (~7%). PrestaShop has a community in Romania (the platform’s multilingual support and open source nature align well with local developer communities). Close behind, OpenCart is the fourth most used, powering around 2,179 stores (~6.8%). OpenCart has been historically popular in Eastern Europe for its simplicity.
Importantly, Romania has a couple of homegrown e-commerce solutions that make the top-five list. Gomag, a Romanian e-commerce SaaS platform, is used by about 1,773 stores (~5.6%). Another local platform, MerchantPro (formerly ShopMania BIZ), appears with a few hundred stores (~896 identified, ~3%). These local providers offer Romanian-language interfaces and local payment/shipping integrations, which can attract merchants. While Gomag’s share is notable, it still trails far behind WooCommerce.
The remaining portion of the Romanian market includes Magento (~828 sites, ~2.6%), along with other small players (including some regional ones like OpenCart as mentioned, and possibly osCommerce and Oxid with tiny footprints). The trend in Romania is that WooCommerce overwhelmingly dominates, with Shopify being the main international alternative, but local e-commerce service providers like Gomag have carved out respectable niches by addressing country-specific needs.
Sweden has a robust e-commerce sector with about 38,965 webshops. The Swedish platform distribution looks somewhat similar to Norway’s. WooCommerce holds the lead with roughly 13,293 sites (~39% of Swedish webshops). Shopify is not far behind at about 11,354 sites (around 34% share). The difference between them is only about 5% of the market (~2,000 stores), indicating a close contest in Sweden as well. Combined, these two account for roughly 73% of Swedish online stores.
The remaining 26-27% use other platforms. One noteworthy local platform in Sweden is Quickbutik, which is the third most popular solution with about 2,809 sites (~7.2%). Quickbutik is a Swedish e-commerce platform geared toward small businesses, and its ~7% share shows a significant minority of merchants opt for it, possibly for its simplicity and Swedish-language support. Another local contender is Wikinggruppen (part of Visma), which appears with a few hundred stores (~528 identified, around 1.4%).
Sweden also has a relatively higher incidence of custom-built stores - around 1,151 custom e-commerce sites (~3.0%) were noted, which could include large retailers and boutiques with bespoke solutions. Magento is used by around 932 sites (~2.4%), and PrestaShop by a similar number (~728 sites, ~1.9%). Additionally, Wix and Squarespace (general website builders with commerce capabilities) together account for a few percent (Wix around 480 sites, for instance).
In summary, Sweden’s e-commerce platforms are dominated by the top global two, but a healthy ecosystem of local services like Quickbutik and other specialized platforms thrives in the shadow of those giants. The competition between WooCommerce and Shopify in Sweden is intense - only a 4% market share difference - showing that Swedish merchants are split between the convenience of Shopify and the flexibility of WooCommerce, with neither running away completely with the market.
Slovakia, with around 17,616 online stores, presents an interesting case where a regional platform plays a major role. WooCommerce is still number one at roughly 7,144 Slovakian webshops (about 41% of the market). However, unlike most countries where Shopify is the automatic second, in Slovakia the second-place platform is Shoptet with about 3,502 webshops (~20-22% share). Shoptet is a Czech-based e-commerce platform very popular in Central Europe, and its strong showing in Slovakia (over a fifth of Slovak webshops) is testament to that regional influence.
Shopify, by contrast, is less prevalent - it actually ranks fourth in Slovakia. The third spot belongs to PrestaShop (~1,309 stores, ~7%) and Shopify comes in fourth with around 1,183 stores (~6.7%).
The remaining ~25% of Slovak stores are split among other providers. After Shopify, OpenCart accounts for roughly 800 stores (~4.5%). There are also a couple of local Slovak/Czech solutions further down: for example, Webareal (~727 stores) and eShop Rýchlo (eShop Rychle) (~529 stores) each have a small share. Upgates, another Czech platform, appears with a few hundred Slovak shops as well. The key insight for Slovakia is that regional integration matters - Shoptet’s platform offers integrations to Central European marketplaces and local services, which has made it more popular than even Shopify for Slovak merchants. This is a reminder that in certain markets, being attuned to local commerce ecosystems (language, marketplaces like Heureka or Alza, local payment gateways) can give a platform a significant edge. WooCommerce still leads thanks to its general appeal and flexibility, but Shoptet’s high adoption shows that merchants will embrace a solution that caters to their regional business needs, even if a global option is available.
Looking across all these countries, a few clear trends emerge.
In virtually every country analyzed, these two platforms account for well over half (often around 70% or more) of all online stores. WooCommerce tends to lead in markets with strong DIY or open-source communities, while Shopify often gains in markets where turn-key solutions are in demand. Their combined dominance poses a high barrier to entry for any new platforms - unseating either would require not just converting a few merchants, but a massive migration that seems unlikely unless a radically better value proposition comes along.
We see this clearly in places like Hungary (Unas, Shoprenter), Norway (MyStore, 24Nettbutikk), Finland (MyCashFlow), Czechia/Slovakia (Shoptet, Webareal), and Romania (Gomag, MerchantPro). These platforms succeed by catering to local languages, regulations, and business practices, offering features or integrations out-of-the-box that global platforms might not handle as smoothly (for example, integration with local marketplaces, tax rules, or popular domestic payment methods).
While none of these local providers comes close to dethroning the top two in absolute numbers, they often secure a solid third-place position - sometimes even second, as Shoptet does in Slovakia - capturing anywhere from 5% to 25% of their home market. This indicates an industry fit advantage: in specific niches or regions, a tailored solution can beat a one-size-fits-all global platform. For e-commerce leaders, this means it’s important to be aware of and integrated with local platforms when operating in those markets, as they may have a loyal user base.
The data reflects a broader shift from open-source, self-hosted carts (like Magento, PrestaShop, OpenCart) toward SaaS and cloud-hosted solutions (like Shopify, and to an extent local SaaS like Shoprenter or Shoptet).
A decade ago, platforms like Magento and PrestaShop were among the top choices in Europe. Today, Magento powers only a small percentage of stores in these countries (generally 2-5%), and PrestaShop, while still significant in some markets (up to ~12% in Lithuania, ~9% in Italy), is far behind the leaders. This doesn’t mean these platforms are disappearing - indeed, Magento remains a top choice for many high-traffic and complex stores (often enterprise B2C or B2B, where its scalability and customization shine, even if the count of Magento stores is low) (mgt-commerce.commgt-commerce.com).
PrestaShop similarly maintains a strong community among mid-sized merchants who prefer open source. However, the growth seems to be with easier-to-deploy, maintenance-free solutions. Shopify’s growth is evident across Europe, even in traditionally resistant markets like Germany (where it reportedly grew its market share 35% since 2018 to take the lead (cedcommerce.com). WooCommerce, while open-source, benefits from being a plugin to WordPress - thus riding the coattails of the world’s most popular CMS - and remains accessible to non-developers via hosting providers and one-click installs, keeping it competitive in the era of SaaS.
Different platforms tend to appeal to different segments of the market:
WooCommerce is favored by content-driven businesses (who already use WordPress) and smaller merchants who want full control with minimal cost. It’s highly flexible with plugins, but requires more hands-on management. The data shows WooCommerce having especially high shares in countries with strong WordPress usage and developer communities (e.g., Estonia, Italy, Netherlands).
Shopify appeals to merchants who prioritize ease of use, reliable hosting, and a rich app ecosystem without needing technical know-how. Its surge in countries like Germany and Iceland underscores how a user-friendly, all-in-one solution can rapidly gain trust, even in markets that once prized self-hosted solutions (cedcommerce.com). Shopify is also increasingly capable of serving larger merchants (Shopify Plus), which may further grow its share among enterprises.
PrestaShop and OpenCart still appeal to budget-conscious or technically oriented merchants, especially in Eastern and Southern Europe, who want an open-source store but perhaps find Magento too heavy. These platforms are often used for small-to-mid shops that need specific customizations and local hosting. Their share is shrinking in many places, but they remain part of the mix (often in the 5-15% range in various countries).
Magento (Adobe Commerce) has shifted to an enterprise focus. The relatively low count of Magento stores hides the fact that many larger retailers and B2B wholesalers run on Magento for its advanced features and scalability. For example, Magento is estimated to hold about an 18% share of Europe’s e-commerce revenue or enterprise usage (though only a few percent of the count of stores) (mgt-commerce.commgt-commerce.com). It remains strong in specific sectors like fashion and auto parts in Europe, where its robustness and the availability of skilled Magento developers are valued.
Local platforms often differentiate through localized capabilities: e.g., Shoptet’s integration with Central European marketplaces, MyCashFlow’s understanding of Finnish payment systems, or Dandomain’s tie-ins with Danish ERP software. Industry-wise, some local platforms cater to certain industries (for instance, Lightspeed’s strength among restaurants and brick-and-mortar retail with its POS integration). Quickbutik in Sweden markets itself to boutique retailers. These platforms might not scale globally, but they fit the industry and regional needs of their target users extremely well, ensuring their survival amid global competition.
The overall trend is a consolidation toward a few major platforms (especially Shopify and WooCommerce). Shopify’s aggressive growth is a common thread - it’s growing its share in essentially every market, often at the expense of older local solutions or smaller platforms. WooCommerce also continues to grow in absolute terms (the number of WooCommerce stores is rising), though its market share in some places is plateauing or falling slightly where Shopify gains. Platforms like Magento and PrestaShop, while still gaining new sites, are growing much slower or even declining in share as merchants replatform to easier solutions. Local platforms show mixed trends: some are growing (e.g., Shoptet’s expansion from Czech into Slovakia, or Gomag in Romania attracting sellers moving online), while others may be slowly losing ground if they can’t match the features or marketing of the global competitors. For example, the data for Germany implies platforms like Shopware and JTL, despite being robust, have ceded the #1 spot to Shopify and may need to innovate to maintain relevance.
In conclusion, understanding which e-commerce platforms dominate in each country is valuable for anyone in the e-commerce industry. If you’re a technology or service provider, these insights help in estimating your total addressable market on each platform and prioritizing integrations - for instance, focusing on WooCommerce and Shopify covers ~70% of shops off the bat, but if you target a country like Hungary or Slovakia, you’d miss a large chunk if you ignore local platforms. For e-commerce merchants or investors, knowing the popular platforms can guide you toward the solutions with the strongest local ecosystems (developers, agencies, plug-ins) in a given region.
Despite the pan-European dominance of WooCommerce and Shopify, the diversity of platforms in the remaining share is a reminder that one size does not fit all. Each market has its nuances, and platforms that align with local languages, regulations, cross-border possibilities or industry niches can capture significant share. As the e-commerce sector continues to grow and evolve, keeping an eye on platform popularity and trends in each country can provide a strategic advantage - whether that’s choosing a platform for your next webshop or deciding which markets to expand platform-specific services into. The data confirms a broad trend toward a few leading frameworks, but also highlights where opportunities lie in serving the ecosystems around the myriad of other platforms that together still power tens of thousands of European webshops.
Sources: The platform usage data is derived from a 2025 analysis of hundreds of thousands of European webshops (Tembi Market Intelligence and other sources). Additional context on regional platforms and market shares was taken from industry reports and studies. Each country section above cites specific data sources.
PROVADA Conference 2025, Amsterdam 17-19 of June.

At Tembi we've analysed data from 200,000+ companies in the Netherlands to predict where demand is heading. Discover how AI helps you identify new tenants, locations, and growth areas - before the competition. By collecting company and financial data, and combining it with location data, we visualise how different areas in cities develop, giving you the insights you need to better understand the sourraoundings of a buidling.
Meet the team:


Read more about our Real Estate solution.
Across Europe, the last-mile delivery landscape is rapidly evolving, driven by consumer preferences, sustainability pressures, and regulatory changes. Recent data from delivery providers, postal services, and consumer surveys across 13 European countries - Sweden, Denmark, Finland, Norway, Italy, the Netherlands, Slovakia, Latvia, Lithuania, Estonia, Hungary, Bulgaria, and Romania - reveals distinct regional patterns in how online purchases reach consumers.
A recent analysis from our e-commerce database, based on data from over 140,000 webshops across these countries, provides deeper insights into how extensively online retailers offer different delivery methods.

Nordic countries have strongly adopted out-of-home (OOH) delivery methods, including parcel shops and lockers. Sweden traditionally favours parcel shops, with Tembi’s data showing 36.1% of Swedish webshops offering this method. Denmark stands out with parcel shop deliveries offered by 57.6% of webshops, reflecting extensive and convenient networks.
Finland is a leader in parcel locker adoption - 34.1% of Finnish webshops offer locker delivery, supported by a widespread network of accessible 24/7 lockers. Norway balances between home (52.1% of webshops) and parcel shop deliveries (33%), with locker installations growing at 9%, indicating increasing preference for flexible, automated solutions.
Estonia, Latvia, and Lithuania showcase exceptional acceptance of parcel lockers. In Estonia, a remarkable 71.8% of webshops offer parcel lockers, validating Estonia’s leadership in locker infrastructure. Lithuania and Latvia follow closely, with 66.4% and 54.7% respectively offering parcel lockers, strongly supporting consumer preferences for convenience and reduced environmental impact.
In Western Europe, the Netherlands strongly prefers collect-yourself options, with Tembi data showing 76.4% of Dutch webshops offer this method. Home delivery remains prevalent, offered by 27.5% of retailers, aligning with the Dutch consumer's primary preference for doorstep delivery but complemented significantly by collect-yourself options.
Italy, traditionally a home-delivery market, now shows a strong adoption of collect-yourself options, offered by 64.9% of Italian webshops. Out-of-home delivery is now Italy's second most popular delivery option after home delivery, driven by convenience and reliability.
Eastern European markets like Slovakia, Hungary, Romania, and Bulgaria traditionally favoured home delivery but now rapidly integrate OOH options. Slovakia prominently features home delivery (76.9%) but also offers parcel shops through 42.9% of webshops, echoing the region's evolving preferences.
Hungary continues to favour home delivery significantly (82.6%), but parcel lockers have rapidly expanded, with about 37.7% of webshops offering this method. Romania, while strongly home-delivery oriented (83.9%), sees parcel lockers emerging as supplementary (21.2%).
Bulgaria uniquely highlights workplace delivery, offered by 36.2% of online retailers, underscoring its importance in urban logistics. This method provides practical advantages in urban areas where home deliveries may face reliability challenges.
Belgium recently mandated online retailers offer at least two delivery options at checkout, including one eco-friendly alternative such as parcel shops or lockers. Effective from 2024, this regulation aims to reduce failed deliveries, lower emissions, and encourage sustainable consumer choices (bpost, 2024). This legislative move sets a precedent that other European countries might soon follow.
Parcel lockers and out-of-home delivery significantly reduce last-mile delivery emissions, potentially cutting CO₂ by approximately 30% compared to home delivery, especially when consumers collect parcels using sustainable transport methods (McKinsey, 2024). Dense networks of lockers and collection points, common in Estonia, Finland, and the Netherlands, enhance urban delivery efficiency, reduce traffic congestion, and improve consumer satisfaction.
European last-mile delivery is undeniably trending towards flexible, sustainable methods that reflect varied regional consumer behaviours. As OOH options mature and consumer awareness grows, home delivery will increasingly coexist with alternative methods. Carriers and retailers who proactively adapt will lead in delivering not just parcels, but also consumer satisfaction and sustainability.
European online payments are shaped by a mix of global platforms and strong local preferences. Below we break down the key payment providers across eight countries – Belgium, Switzerland, Denmark, Finland, Italy, Norway, and Sweden – highlighting who’s active in each market, how they fare in B2B vs B2C, and domestic vs cross-border trends. We also discuss how platform-native solutions (like Shopify Payments and PayPal integrations) enable cross-market reach.
The analysis is based on 208.035 webshops monitored by Tembi with data from the 21st of May 2025.
Belgium - 18.237 active webshops
Switzerland - 30.007
Denmark - 32.370
Finland - 15.912
Italy - 63.672
Norway - 15.032
Sweden - 32.805
Belgian e-commerce is dominated by Bancontact, the national debit scheme, which remains by far the favourite online payment method – about 73% of Belgian shoppers prefer Bancontact and 70% use it most often (retaildetail.eu). Credit cards, once top, now take a secondary role mainly for higher-value purchases (pay.com.)

Key Providers and Roles:
Domestic vs international adoption
Domestically, a Belgian online shopper expects to see Bancontact at checkout – it’s a trust signal and caters to local payment habits. International e-commerce players entering Belgium must integrate Bancontact (often via Shopify Payments or Adyen) to localise their offering (retaildetail.eu). Conversely, Belgian merchants aiming cross-border include methods like PayPal and credit cards to accommodate foreign customers who can’t use Bancontact. Thus, Belgian sites serving neighboring markets often support both local and global methods. This dual approach (Bancontact + an international wallet) is common in Belgium’s e-commerce, ensuring both local and cross-border sales are covered.
Switzerland’s payment mix is unusually diverse. Traditionally, bank transfers and invoices have been extremely popular – as of 2023, bank transfers (including pay-by-invoice) were projected to account for ~46% of Swiss e-commerce transactions (pay.com) Cards are also widely used (52% of online transactions, mostly credit cards in online contexts (pay.com). But the biggest shake-up has come from Twint, the Swiss mobile payments app. In recent years Twint has surged to become the dominant online payment method: it’s now accepted in roughly 4 out of 5 Swiss online shops (twint.ch) and counts over 5 million active users in a country of ~8.7 million (pay.com).

Key Providers and Roles:
Domestic vs international
The Swiss market is small but high-spending, and cross-border e-commerce is significant (many Swiss buy from German, French, or global sites). Domestic shops therefore try to offer a mix of local and international methods. For instance, a Swiss webshop will almost certainly offer Twint and PostFinance for locals, but also Visa/Mastercard and PayPal to appeal to everyone (including cross-border shoppers or expatriates). International retailers entering Switzerland often integrate Twint now – given its reach, not having Twint could alienate a big chunk of local customers. At the same time, Swiss consumers use credit cards and PayPal especially when shopping on foreign sites, since those universally work. This dynamic means successful cross-border sellers into Switzerland either enable local methods via a PSP (Adyen, etc.) or rely on the Swiss buyer falling back to a credit card or PayPal. In summary, Swiss e-commerce shows a dual nature: traditional methods (bank transfer/invoice) remain very strong at home (pay.com), but mobile and global solutions are rapidly overlaying to facilitate seamless buying both domestically and across borders.
Denmark is a card-centric country with a twist – nearly every Dane has a Dankort (the national debit card, typically co-branded with Visa), so card payments have long been the norm. In 2024, about 37% of Danish online consumers cited paying by card as their primary method (ecommercenews.eu). Close on its heels, however, is MobilePay, used by roughly 33% of online shoppers as their preferred option (ecommercenews.eu). MobilePay, a mobile wallet linked to card or bank accounts, has become nearly ubiquitous (over 90% of Danes have the app, and virtually all younger adults do (statista.com)). PayPal and other methods exist but are less prominent – a few years ago PayPal accounted for ~13% of Danish online payments (oosga.com), and it remains a common option particularly for cross-border purchases. Overall, Denmark’s landscape mixes global card infrastructure with highly adopted local fintech solutions.

Key Providers and Roles:
Domestic vs International Adoption
Danish online retailers focus on domestic preferences first – supporting Dankort/Visa and MobilePay to cover the vast majority of local transactions. Cross-border, Denmark has a high rate of consumers buying from abroad (over half shop abroad monthly (ecommercenews.eu), so Danish merchants also consider methods that international shoppers use. This means accepting foreign Visa/Mastercards (no problem via standard acquiring) and often keeping PayPal available. International merchants selling into Denmark are wise to enable MobilePay – increasingly, payment platforms (like Stripe or Adyen or Shopify Payments) let them do so easily. We see that cross-border giants (Amazon, etc.) have started to include MobilePay for Danish customers. In summary, domestic Danish e-commerce is characterised by card and MobilePay dominance, whereas cross-border commerce relies more on international card networks and PayPal – but the gap is closing as local methods become accessible to foreign merchants too.
Finnish online shoppers have a strong preference for direct bank payments. Rather than using individual bank buttons, Finland streamlined this through Paytrail, an aggregator that connects all major Finnish banks. As a result, online bank transfer solutions like Paytrail are the top choice for Finns (aboutpayments.com). According to industry info, Finnish consumers most prefer paying via their internet banking through services such as Paytrail or Trustly (aboutpayments.com). Cards are of course used as well, but historically Finland has seen lower credit card usage online than many other European countries. Instead, debit cards via bank transfer and recently mobile wallets are prominent. MobilePay (imported from Denmark) has also gained traction in Finland – it’s available and used by many, though not yet as dominant as in Denmark. Klarna is popular in Finland too (Finland was an early Klarna expansion market), and invoice payments are fairly common for certain purchases. In summary, Finland’s payment scene is a mix of bank-centric methods and a few select international options.
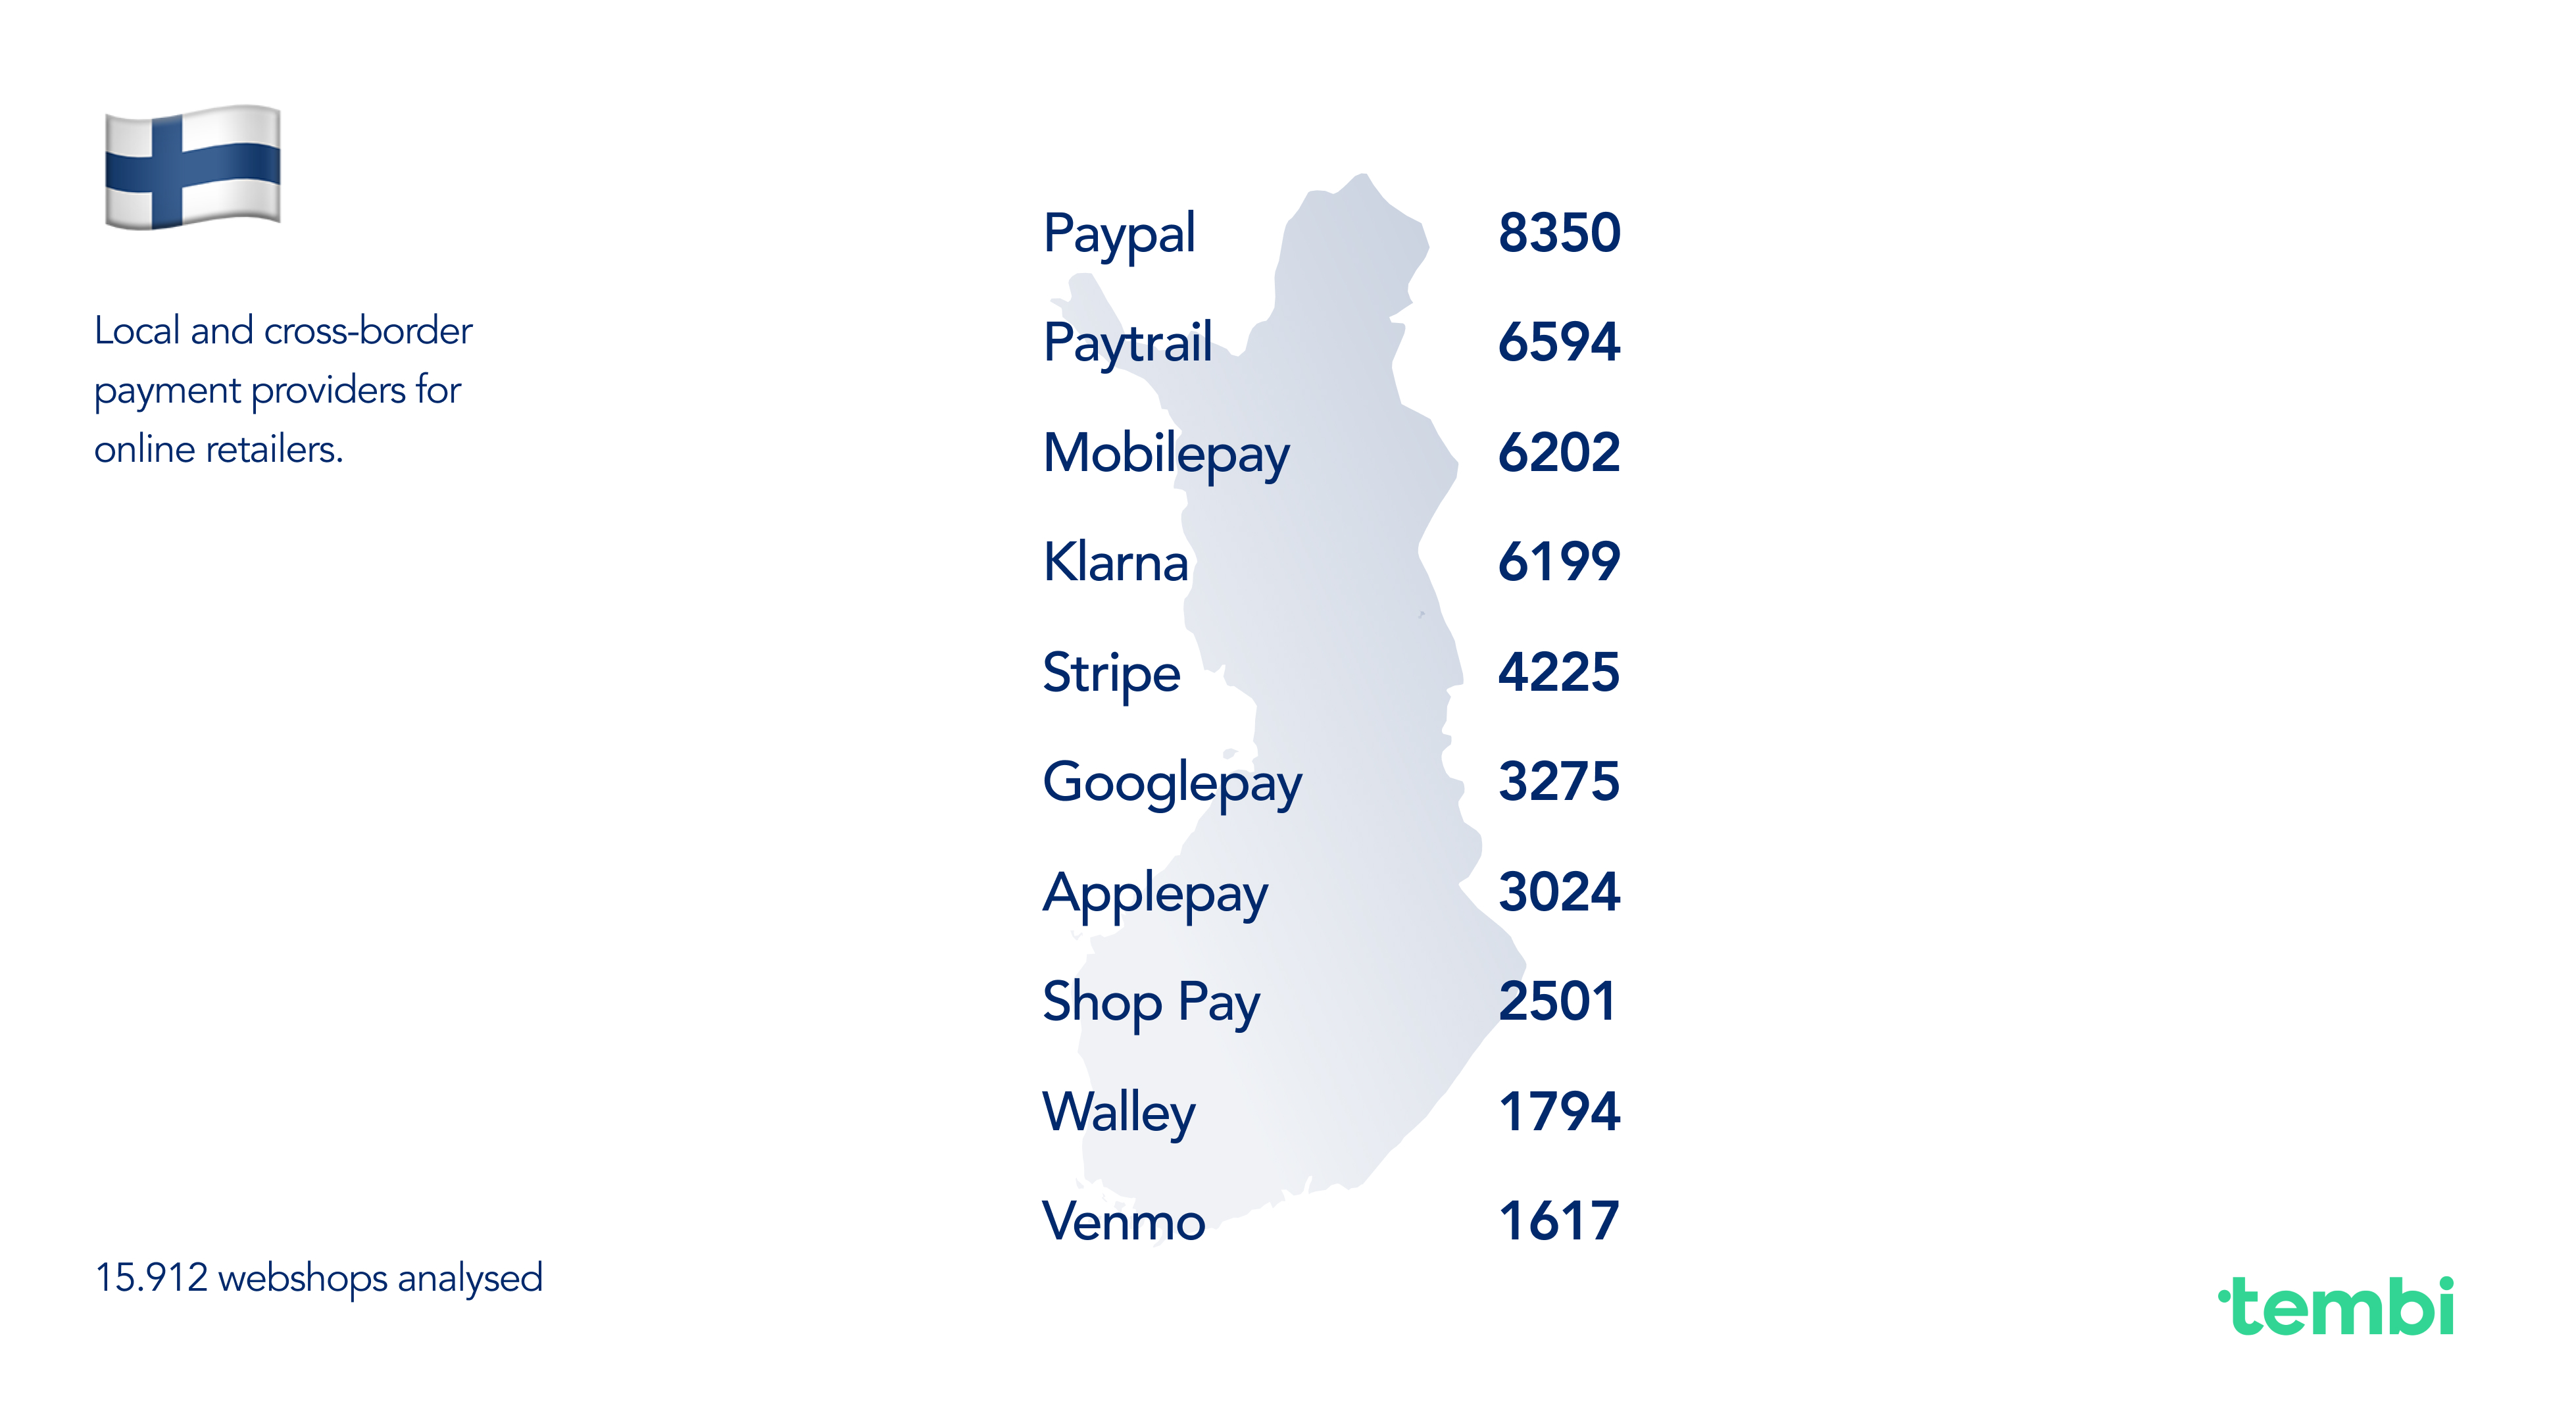
Key Providers and Roles:
Domestic vs International
Finnish e-commerce is quite domestic-focused in method – a Finnish shopper expects to pay through their bank or an invoice. International merchants expanding to Finland often partner with Paytrail or a similar PSP to offer localized bank payments, because without those, they’d miss a large portion of sales. The prevalence of English-speaking Finns means many do shop on international sites, where they might then use a credit card or PayPal if Finnish bank options aren’t available. Indeed, PayPal is accepted on many Finnish sites (though not top-five in preference, it’s present on ~8,300 Finnish webshops per our data), functioning as a catch-all for cross-border transactions (e.g. paying a non-Finnish merchant). Adoption trends show that methods like Paytrail keep domestic transactions flowing in local currency and language, whereas global platforms like PayPal or card networks come into play for cross-border. Additionally, Finland being in the Eurozone makes cross-border shopping easier (no currency swap issues), so credit cards are slightly more used for EU-wide shopping. Finnish merchants, to expand abroad, will lean on PSPs that support international cards, PayPal, and possibly multi-currency – many use Stripe (found on ~4,200 Finnish sites) or Adyen for that reason. In sum, Finland has a strong local backbone (bank payments) that any entrant must integrate, and a willingness to layer global methods on top for broader reach.
Local Payment Landscape: Italy stands out for the prominence of PayPal in e-commerce. Italians have historically been cautious about online payments, leading them to gravitate towards PayPal for its perceived safety and buyer protection. Recent surveys show about 63% of Italian online consumers used PayPal in the past month, and 39% prefer PayPal over any other method – making it the #1 choice by far (rapyd.net). Credit and debit cards are of course used (especially with the widespread CartaSi/VISA and MasterCard), but only ~11% of Italians picked credit cards as their first choice, according to the same study (rapyd.net). Interestingly, a uniquely Italian method, the PostePay prepaid card (issued by the postal service), ranks high – about 12% choose it as their top payment method (rapyd.net). PostePay is essentially a reloadable Visa/Mastercard, and its popularity reflects Italians’ preference for controlled, cash-loaded spending. Cash on delivery (contrassegno) still lingers as an option in Italy for some categories, though its share is decreasing as digital payments grow. Overall, Italy’s online payment mix is a blend of global wallets, card networks (often through domestic brands like CartaSi or PostePay), and some remaining traditional methods.

Key Providers and Roles:
Domestic vs International
Italian merchants historically catered to domestic buyers’ preferences (hence a heavy emphasis on PayPal). Now, with cross-border e-commerce growing (two-thirds of Italian shoppers have bought from international sites (rapyd.net)), Italian merchants are expanding their payment options. Many are adding methods like Amazon Pay (since Italians shop on Amazon’s platforms), or enabling multi-currency credit card processing to attract foreign customers. Likewise, foreign companies selling to Italy have learned that including PayPal at checkout is crucial – a UK or German site that adds PayPal might suddenly convert many more Italian buyers who trust PayPal over entering card details. We see platform-native solutions smoothing this process: for example, Shopify Payments allows a foreign merchant to offer Italian shoppers local payment options (like bonifico via Sofort or appropriate localized card forms) without that merchant needing an Italian banking relationship. Additionally, services like Klarna have recently launched in Italy as well, aiming to introduce more pay-later options; their usage is nascent but growing for cross-border purchases (e.g. an Italian buying from a German shop might use Klarna). In summary, Italy’s e-commerce shows a stark local preference for PayPal and familiar tools, and both domestic and international sellers adjust to that reality – often by prominently featuring PayPal, offering prepaid-friendly options, and maintaining trust signals. The reliance on platform solutions (PayPal, Amazon Pay, etc.) also lowers the friction of cross-border commerce for Italian consumers, effectively bridging domestic habits with international retail.
Norway’s consumers are highly digital and spend a lot online. Card payments are extremely common – in fact, Norway has one of the highest per-capita card usage rates. Cards (debit and credit combined) account for roughly 43% of all retail transactions (online and offline) in Norway (pay.com). The majority of these are through BankAxept, Norway’s domestic debit card system, which is co-branded with Visa/Mastercard for international acceptance (pay.com). Alongside cards, Norway has a very strong mobile payments culture thanks to Vipps, a mobile wallet app used by most Norwegians. Vipps has cornered the digital wallet market in Norway (pay.com), meaning alternatives like Apple Pay or Google Pay are secondary (though available). Klarna and other pay-later options are also popular – Norway, like other Nordics, embraced Klarna early for splitting or delaying payments. PayPal exists but plays a smaller role in day-to-day domestic payments (around 7% share of online transactions as per Norges Bank (pay.com)), used mainly for cross-border shopping. In summary, Norway’s landscape features high card usage with a layer of mobile wallet convenience and BNPL flexibility.

Key Providers and Roles:
Domestic vs International
Norway’s e-commerce players pay attention to both local preferences and the fact that Norway is outside the EU (which affects cross-border trade, VAT, etc.). Domestically, a Norwegian merchant will emphasize Vipps and Klarna alongside cards to maximize conversions – these are what local shoppers expect. Internationally, Norwegian merchants know that foreign customers won’t have Vipps, so they ensure card payments (Visa/Mastercard) and PayPal are available. Many also support Klarna’s global offering in other markets (since Klarna operates across Europe and even the US, a Norwegian merchant can offer pay-later to customers in those countries via Klarna). Moreover, with high English proficiency, Norwegians frequently shop abroad; when they do, they typically use cards or PayPal – indeed PayPal’s main utility in Norway is for cross-border purchases (pay.com). This behavior influences Norwegian e-commerce sites too: for example, the prevalence of PayPal on Norwegian sites is partly to reassure and facilitate sales to non-Norwegians (and to Norwegians who might prefer it in certain situations). Another interesting point is that as part of the Vipps-MobilePay merger, Nordic payment integration is improving – soon a Danish customer might pay a Norwegian shop with MobilePay and it seamlessly works with Vipps (and vice versa). This will strengthen cross-Nordic commerce by leveraging each country’s local wallet. In summary, Norway shows a pattern seen in the Nordics: very high local adoption of innovative payments, and a parallel support of global methods to engage in cross-border commerce.
Sweden’s online payment landscape has two giants: Klarna and Swish. It’s often said that “everyone in Sweden uses Swish,” and that’s barely an exaggeration – about 98% of Swedish adults have Swish installed and ~95% use it regularly (ergomania.eu). Swish is a mobile payment system (bank account-linked) originally for P2P but now widely used in e-commerce and even brick-and-mortar. On the other hand, Klarna’s pay-later services (invoice, installment, etc.) account for a huge portion of Swedish e-commerce – over 50% of online transactions by value are open invoice payments (adyen.com) - many of those facilitated by Klarna and a handful of competitors. Credit/debit cards remain popular too (especially for some online services and travel), but Sweden stands out in that invoices/payment after delivery are the single largest category, surpassing cards (adyen.com). This is rooted in consumer behavior: Swedes historically liked to receive goods and pay by invoice, a practice that fintechs like Klarna turned into a smooth digital experience. Meanwhile, Swish’s instant bank transfers are siphoning off transactions that might have been card or cash. PayPal exists and is used in Sweden, but given the strong local options, it’s not a leading method for domestic shopping. Overall, Sweden is extremely advanced: high smartphone usage, multiple fintech solutions, and consumers comfortable with alternative payments.

Key Providers and Roles:
Domestic vs International: Swedish e-commerce players are very outward-looking (Swedes buy from international sites and Swedish sites sell abroad, especially to the EU). For domestic sales, not offering Klarna or Swish is almost unthinkable for a mainstream merchant – you’d lose too many sales. For cross-border, Swedish merchants rely on those platform capabilities: Klarna is expanding in many markets, so a Swedish merchant can offer Klarna in, say, Germany or the UK to attract foreign customers similarly. Swish, however, is domestic; a non-Swedish customer cannot use Swish, so Swedish merchants must also have card payments and PayPal to cover foreigners. This they generally do – either via a PSP or via Klarna Checkout (which by default shows local Swedish options but can fall back to card for others). International merchants entering Sweden often partner with Klarna to quickly gain local credibility. It’s common for foreign brands launching Swedish sites to heavily feature Klarna and Swish logos – it signals to Swedish shoppers that “you can trust and pay easily here”. Additionally, Sweden’s high trust in fintech means new entrants can get traction – e.g. Stripe is used by many startups in Sweden and can process Swish via plugins, so newcomers can offer Swish with minimal effort. Platform-native solutions like Shopify Payments also support local methods in Sweden (Shopify merchants can enable Klarna and Swish through integrations), which lowers the barrier for smaller foreign merchants to sell to Swedes. A noteworthy cross-border trend is the Nordics integration: with Vipps, MobilePay, and Swish collaborating, a merchant in one Nordic country might soon accept a wallet payment from a neighboring country’s app seamlessly. This will further blur domestic vs international in the Nordic region’s payments. All told, Sweden’s market is characterized by extremely strong local preferences (Swish, invoicing) that any successful player must adapt to, and a parallel accommodation of global methods for complete coverage. Swedish consumers will happily use a local method if available, but if shopping on a foreign site, they might use a card or PayPal – however, their expectation now is that more and more foreign sites will cater to them with Swedish methods.
One recurring theme across all these countries is the role of platform-native payment integrations – especially on popular e-commerce platforms like Shopify and WooCommerce – in streamlining cross-border payment acceptance. Two prime examples are Shopify Payments (with its local method support) and PayPal’s ubiquitous plugins.
Shopify Payments (and Shop Pay)
Shopify Payments is the built-in payment gateway for Shopify merchants, powered behind the scenes by providers like Stripe/Adyen. Crucially, it automatically enables relevant local payment methods based on the shopper’s region. For instance, a Shopify merchant in the US can easily accept Bancontact and iDEAL when selling to Belgium or the Netherlands – they simply toggle those on, no custom integration needed (help.shopify.com). Shopify Payments supports Bancontact, iDEAL, Sofort, EPS, Klarna, etc., depending on the market (help.shopify.com), meaning merchants on Shopify can localize their checkout experience at the flick of a switch. This has huge implications: it lowers the barrier for cross-market expansion since even small merchants can offer country-specific popular methods without in-depth knowledge. Additionally, Shop Pay, Shopify’s accelerated checkout, is available globally – it stores customer details for one-click payments across any Shopify store. Shop Pay itself isn’t a separate payment method funded by a bank or card, but it streamlines card payments and now even installments (Shop Pay Installments by Affirm in some countries). Its presence (noted in our data across countries, e.g. ~6–13k sites in each country had “Shop Pay” enabled) underscores the impact of platform features. Shop Pay improves conversion and thus indirectly encourages merchants to sell globally, knowing returning customers can pay faster. In essence, platform-native solutions like Shopify Payments abstract away complexity: a single integration gives a merchant Apple Pay, Google Pay, local methods and credit cards in one – very powerful for cross-border commerce.
WooCommerce & PayPal/Stripe integrations
WooCommerce (the popular WordPress e-commerce plugin) relies on third-party payment gateways. PayPal and Stripe are two that have become nearly universal on WooCommerce sites globally. Because they are easy to install and free to use (no monthly fee, just transaction fees), many WooCommerce-based shops simply offer PayPal and Stripe out-of-the-box. This means an English WooCommerce site, a German one, or a Danish one – all likely have a similar PayPal checkout option (and Stripe powering card payments). Our analysis of PayPal’s presence found that a significant percentage of Shopify and WooCommerce stores across these countries have PayPal enabled – often 50% or more (e.g. ~72% in Italy, ~47% in Sweden, ~40% in Finland, ~62% in Belgium) based on the data of PayPal usage on those platform stores. This prevalence is no accident: PayPal comes built-in with Shopify and as a default plugin with WooCommerce, so many merchants leave it on as a convenient global method. The result is a kind of cross-market ubiquity – no matter if you’re shopping on a boutique in Oslo or a gadget store in Milan, you’re likely to see the PayPal button. That consistency gives consumers a familiar fallback and gives merchants confidence they can serve international customers (who might prefer PayPal if they’re unfamiliar with the local method on that site). Stripe’s integration on WooCommerce similarly allows merchants worldwide to accept not just cards but Apple Pay, Google Pay, and even local methods (if configured) like iDEAL or Klarna through Stripe. So, platform ecosystems have made a set of payment methods effectively universal across markets.
Cross-Border Influence of Key Players
Certain providers emerge as bridges across countries. PayPal is the obvious one – present virtually everywhere, it’s the default cross-border wallet. Stripe/Adyen as PSPs power many local methods but are invisible to consumers; their influence is in enabling merchants to support the right mix in each market. Klarna has grown from a Swedish BNPL to a global brand now active in all the discussed countries – a German shopper, a Norwegian, an Italian can all use Klarna, making it a cross-border payment option in its own right. Apple Pay and Google Pay – while not top of any country’s list except perhaps on tech-centric sites – provide a unified experience for a segment of users across borders (a tech-savvy Swiss or Italian might choose Apple Pay in lieu of typing card details, for example). Mollie and Nets/Nexi (regional PSPs) are extending beyond their home (Mollie from NL into Belgium, France, etc., Nets from Nordics into DACH), contributing to cross-pollination of methods.
In summary, platform-native integrations and globally-oriented providers smooth out the differences between markets. They ensure that a merchant doesn’t have to integrate Bancontact, iDEAL, Klarna, Swish separately with different contracts – instead, one integration (be it Shopify Payments, PayPal, Stripe, etc.) covers it. This has led to a situation where key payment methods achieve strong cross-border presence despite being local in nature: for example, Bancontact can be accepted by a German Shopify store selling to Belgium, and iDEAL appears on UK websites via PayPal’s Braintree or Adyen. Likewise, a Dutch merchant can easily offer Klarna to German customers through a single PSP. The significance is huge for market entry and expansion: a merchant can enter a new European market and immediately offer the familiar local payment options through their existing platform, rather than needing to sign deals with local banks. This greatly lowers friction in European e-commerce, effectively enabling the regional patterns we’ve discussed to coexist with global e-commerce flows.
Analysing these seven countries side by side reveals clear regional patterns and instructive differences:
Local dominance vs global universals
Each country has one or two dominant local payment methods – Bancontact in Belgium, Twint in Switzerland, MobilePay in Denmark, Paytrail (bank transfers) in Finland, PayPal (local favourite) in Italy, Vipps (and cards) in Norway, Klarna/Swish in Sweden. These methods stem from local banking systems or consumer habits and command loyalty in their home markets. At the same time, global methods like credit cards and PayPal are present “just about everywhere” (retaildetail.eu) as the common denominators. Cards are accepted in all countries (even if not always first choice), and PayPal’s familiar checkout is offered broadly to capture cross-border shoppers. This duality means successful merchants typically combine the local must-haves with a baseline of global options.
North vs south vs central
There’s a north-south divide of sorts. The Nordics (Denmark, Norway, Sweden, Finland) are heavy on mobile wallets and pay-later solutions: MobilePay/Vipps/Swish and Klarna/Svea are household names there, reflecting a tech-forward consumer base and trust in digital finance. Central-West Europe (Belgium, Netherlands, Switzerland) leans on bank-based payments: Bancontact, iDEAL, Twint, Sofort – these are all bank-account-direct methods, indicating the strength of bank networks and a preference for direct debit-style payments. Southern Europe (Italy) has been more cautious historically, thus PayPal (a “foreign” but trust-building method) and cash/prepaid solutions took hold. Understanding these cultural and historical contexts is key – one size does not fit all in Europe. A Nordics-focused merchant will prioritise mobile wallets and Klarna, whereas a Benelux-focused one must integrate local bank payments or risk losing most customers.
Cross-border influencers – key players
Some payment providers have clearly managed to extend their influence across multiple countries: Klarna (originating in Sweden) is now a major player in Norway, Finland, the Netherlands, Belgium, etc., showing that a popular concept can travel – especially BNPL in regions with similar consumer credit cultures. PayPal remains a pan-European staple for cross-border commerce – even where it’s not #1 locally, it’s the safety net for transactions that cross languages or currencies. Stripe and Adyen (though behind the scenes) power a lot of this by enabling local method acceptance to non-local merchants – they are the unsung heroes making, for example, a French website feel native to a Dutch customer by offering iDEAL. Mollie has grown beyond the Netherlands into Belgium and even across Europe, thanks to its easy integration – it’s becoming a regional champion for SME payments. Meanwhile, regional collaborations (like the Vipps-MobilePay merger and its partnership with Swish) hint at the future: key local methods might interoperate across borders, effectively becoming multi-country methods. If that succeeds, a Nordic wallet could rival card schemes in cross-border utility within that region.
Platform power – shaping market entry
The prevalence of Shopify, WooCommerce, Magento, and other platforms in online retail has greatly shaped how payments are adopted. These platforms have baked-in support for the dominant providers, which means merchants expanding to a new country often have the tools at their fingertips to accept the local payments. For example, a Canadian brand using Shopify entering the Dutch market can enable iDEAL and Bancontact via Shopify Payments in minutes – something that would have been a project on its own a decade ago. This reduces the friction of market expansion; payment localization is no longer a barrier reserved for enterprise retailers with local contracts, but available to SMBs. It also means that certain payment methods achieve widespread adoption simply by being defaults on platforms – PayPal’s presence on WooCommerce is a clear case. In effect, the e-commerce platforms act as conduits for spreading payment innovations across borders. If tomorrow a new payment method becomes huge in one country, chances are platform providers or PSPs will integrate it and thereby propagate it across thousands of merchants in multiple countries (much like Apple Pay rolled out or Klarna became a checkout option globally).
Consumer behaviour and trust
Underpinning all of this, local consumer behaviour and trust patterns dictate what gets used. In Belgium and Netherlands, trust in one’s bank and domestic systems is high – hence bank-based methods flourish. In Italy, wariness about fraud led to a trust in PayPal and cash – only now gradually shifting toward more modern solutions as trust improves. Nordics have high trust both in technology and in credit, enabling things like Swish and Klarna to thrive. These patterns highlight that any payment provider trying to enter a new European market must contend with deeply ingrained habits. Often, partnering or integrating with existing local systems (as Mastercard did by co-badging Bancontact, or as Klarna did by offering localised invoice terms) is more successful than trying to impose a wholly new behaviour.
To conclude, European e-commerce payments are a mix of local traditions and global tech. Merchants aiming for success across these markets need to literally “speak the language” of payments in each country – be it offering installment invoices in Sweden, MobilePay in Denmark, or Bancontact in Belgium – while also providing cross-border staples like cards and PayPal to ensure no customer is left out. The good news is that modern payment platforms and providers have made this mapping far easier. The direction is clear: meet customers’ local expectations at checkout, and they will buy confidently, whether they’re next door or across the continent. By recognizing the strengths and focus of each payment provider (from Twint’s local sovereignty in Switzerland to PayPal’s cross-border indispensability), businesses can craft a payment strategy that feels native in every market they serve, B2C and B2B alike. This localized approach, backed by data and smart integrations, is increasingly what defines competitive advantage in Europe’s vibrant online payments landscape.
Our recent analysis of aggregated data from webshops in selected European countries confirms two straightforward insights about cross-border selling: webshops typically target neighbouring countries or seek out larger markets to grow their potential customer base. While these findings may seem intuitive, the data illustrates clearly how consistently webshops employ these strategies - particularly when supported by strong partnerships with local logistics providers and prioritised investments in localisation.

The obvious role of proximity
Webshops in Denmark primarily target Sweden (18.9%) and Germany (18%), reflecting straightforward cross-border logistics and cultural familiarity. Similarly, Dutch webshops predominantly sell to Belgium (17.4%) and Germany (13.5%), confirming that short distances and established regional logistics make neighbouring countries natural first choices. Swedish webshops follow the same logic, favouring close neighbours Denmark (17.2%) and Finland (15.9%).
Targeting larger markets beyond proximity
Webshops strategically pursue larger markets with robust consumer bases, such as Germany and France, regardless of direct proximity. For instance, Italian webshops commonly sell to Germany (14.2%) and France (14.1%), driven significantly by the size and high purchasing power of these markets, alongside geographical closeness.
Distinctive patterns in Eastern Europe
Webshops in Hungary display notably low cross-border priority: only 4.4% offer shipping options to Germany, Slovakia, and Romania. This cautious approach likely reflects specific economic calculations, infrastructural limitations, or less developed cross-border logistics partnerships, rather than purely geographical factors.
Latvian webshops clearly illustrate the proximity factor again, heavily targeting neighbouring Lithuania (16.8%) and Estonia (15.9%), highlighting ease of trade through geographic and cultural closeness.
Notable differences in cross-border engagement levels
A significant finding from the data is the variation in how actively webshops pursue international markets. Factors driving these differences include the maturity of the domestic e-commerce market, logistical infrastructure, consumer purchasing power, and particularly the level of investment into localisation and logistics solutions. Engagement levels notably decline with increasing distance, indicating logistical complexity and higher costs likely deter webshops from extensive international expansion beyond neighbouring or well-established larger markets.
Concluding remarks
Our aggregated data confirms proximity and market size as primary drivers for cross-border e-commerce decisions. However, the diverse patterns and varying engagement levels suggest that webshop decisions are influenced by more complex strategic factors, including infrastructural readiness, economic conditions, logistical capabilities, and the willingness to invest in localised consumer experiences. These factors ultimately shape cross-border success far more than geographical closeness alone.
Cross-border online sales are an important growth channel for webshops in Europe’s integrated market. This article examines why certain international sales corridors dominate for e-commerce merchants in five European countries – the Netherlands, Germany, Denmark, Italy, and Sweden. We analyse the top export markets of webshops in each country (based on provided top-10 destination data) and explore the factors behind these patterns, including geography, language, economic ties, consumer behaviour, and logistics integration. We also benchmark the maturity of each country’s e-commerce sector (webshop density and online-selling share).The goal is to provide European e-commerce professionals with insight into existing cross-border flows and how to leverage them.
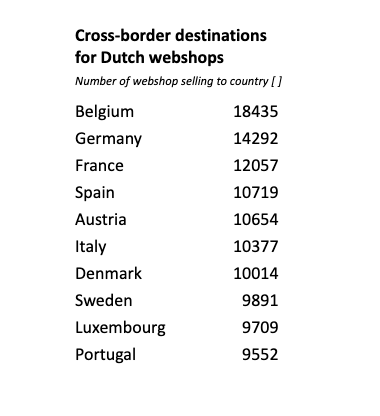
Dutch webshops are remarkably outward-looking, with nearby Belgium and Germany as the top destinations for online exports. Belgium tops the list (a large portion of Dutch cross-border orders), thanks in part to shared language (Dutch is spoken in Flanders) and immediate proximity facilitating quick shipping. Likewise, Germany – Europe’s largest e-commerce market – is a close neighbor and a natural target for Dutch retailers. Geographic centrality and excellent logistics infrastructure in the Netherlands (Rotterdam port, Schiphol airport) make it a hub for distributing goods across Western Europe, so Dutch webshops easily serve France, Spain, and Italy as well (ecommercegermany.com). Many Dutch merchants localise in English or multiple languages, leveraging the population’s high foreign language proficiency. These factors, combined with the Netherlands’ high Internet penetration and consumer spending, explain why Dutch online sellers extend their reach broadly into Europe. The cross-border focus is diverse, but the Benelux and adjacent EU markets dominate Dutch e-commerce exports.

German webshops tend to have a more regional cross-border focus, reflecting Germany’s huge domestic market which somewhat lessens reliance on exports. Nevertheless, German retailers mainly ship to German-speaking neighbours, especially Austria (the top export market) and Switzerland, as well as the Benelux countries (ecdb.com). Austria’s shared German language and culture make it a natural extension of the domestic market, and indeed over half of Austria’s cross-border e-shopping is from Germany (ecdb.com), illustrating this tight linkage. Similarly, a high share of Luxembourg’s online imports come from German sites (ecdb.com), aligning with Germany listing Luxembourg among its top export destinations. Beyond these, German e-sellers target large EU economies like France, Italy and Spain, but volumes there are lower relative to Germany’s size. Geographic proximity and EU single-market ties play a key role – Germany’s neighbours (Austria, Netherlands, France, Poland, Denmark, etc.) comprise most of its top 10 export markets. While Germany has the most e-commerce sales in Europe, its cross-border activity (in percentage terms) is more modest than smaller countries’, as its home market is very self-sufficient. Still, German webshops capitalise on being in the center of Europe by serving nearby countries with minimal barriers.
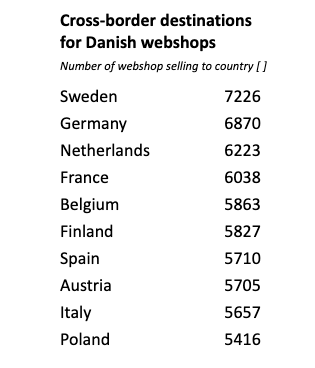
Denmark’s online retailers are highly oriented toward Nordic and nearby EU markets. The top export destination is Sweden, Denmark’s neighbour across the Øresund bridge, reflecting strong regional integration. Danish merchants benefit from cultural and linguistic affinities within Scandinavia (Danish and Swedish are mutually intelligible to a degree), and importantly from a merged postal network (PostNord) that eases Denmark–Sweden deliveries. Germany is the second-most common destination for Danish webshops – a logical outcome of geographic adjacency and Germany’s market size. Other top targets include the Netherlands, France, and Belgium, indicating Danish online retailers don’t confine themselves to Scandinavia. High English proficiency in Denmark and use of international e-commerce platforms enable even small Danish webshops to sell into distant European markets. Finland and Norway also appear in Danish sellers’ top corridors, consistent with a Nordic e-commerce cluster. In sum, proximity and regional ties drive much of Denmark’s cross-border trade, but Danish companies’ agility and the necessity to grow beyond a small domestic market push them to court major economies across Europe as well.

Swedish webshops likewise show a strong Nordic focus coupled with EU-wide reach. Denmark and Finland rank among the top export markets for Sweden’s online retailers, owing to Sweden’s position bridging Nordic neighbours (and sharing a land border with Finland). Cross-border commerce within the Nordics is bolstered by relatively aligned consumer habits and the prevalence of English, though language differences (Swedish vs. Finnish) still pose some barrier. Sweden’s list of top e-commerce export destinations also features Germany, the Netherlands, France, Spain, and Belgium, mirroring a broad Western European outreach similar to Denmark’s. Sweden’s e-merchants benefit from being in one of Europe’s most digitally mature societies, and they leverage efficient logistics links (for example, ferry routes and international carriers) to serve far-flung customers. Still, the easiest wins are nearby: Denmark alone accounts for a significant share of Swedish cross-border online sales, exemplifying how regional integration (e.g. PostNord’s bi-national network) underpins cross-border e-commerce in Scandinavia.

Italian webshops, operating in a large but traditionally less digitized market, concentrate their cross-border sales on Europe’s biggest economies and nearby countries. Germany is the number-one export destination for Italian online sellers by volume, followed closely by France and Spain, which together account for a large majority of Italy’s e-commerce exports (amavat.eu). This reflects both geographic proximity (France and Austria border Italy, and Germany is just beyond the Alps) and strong demand for Italian products (e.g. fashion, design, food) in wealthier EU markets. Austria is another key corridor (benefiting from adjacency and a shared German-language business environment), and neighbors Switzerland and Slovenia (not in the top-ten list provided, but likely significant) also draw Italian exports. Interestingly, Northern European markets like the Netherlands, Belgium, Denmark, Sweden and Poland appear among Italy’s top export destinations as well – indicating that Italian brands have appeal across Europe despite distance. Italy’s cross-border e-commerce has been surging in recent years, growing its share of total online turnover from ~29% to 39% between 2019 and 2022 (amavat.eu). However, Italian webshops are relatively fewer per capita, so much of this cross-border activity is driven by a subset of competitive firms (often via marketplaces). In summary, Italy’s e-commerce exports gravitate toward large EU consumer markets and nearby neighbors, leveraging Italy’s renowned products, even as the domestic e-commerce sector catches up in maturity.
Despite national nuances, these five countries share some common patterns. Neighboring countries dominate cross-border e-commerce flows in many cases – a classic gravity effect where shorter distances, lower shipping costs, and familiar cultures facilitate trade. For example, the Netherlands-Belgium, Germany-Austria, and Denmark-Sweden corridors are all top-ranked, underscoring the importance of geographic proximity and shared language or cultural ties. This aligns with research finding that even online, distance and cultural/language factors still significantly impact trade (though less than offline) (econstor.eu). Additionally, all five nations see major EU economies (Germany, France, Spain) in their export mix. These large markets are attractive targets due to their sheer number of online shoppers – Germany and France are among Europe’s top destinations for cross-border e-commerce imports (ecommercegermany.com). In fact, German consumers are so pivotal that every country’s webshops list Germany as a top-3 foreign market (except Germany itself), and German shoppers account for a sizeable share of many neighbour's’ online sales (ecdb.com).
However, there are clear differences in scope. The smaller, digitally advanced countries (Netherlands, Denmark, Sweden) tend to export to a broader array of markets across Europe, reflecting their need to go global to scale beyond limited domestic populations. Their top-10 lists include more distant EU distinations – enabled by strong English usage and pan-European platforms. In contrast, Germany and Italy (the larger markets) show a relatively more regional focus, concentrating on immediate neighbors and a few key economies. German webshops’ cross-border sales are more regionalized (e.g. mostly EU neighbors), and Italy’s exports tilt heavily to Western Europe (with limited Nordic focus). Another difference is the reciprocity of corridors: e.g. Denmark and Sweden mutually rank each other very high, whereas Italy and Germany have an asymmetry (Italy relies on Germany more than Germany on Italy). This hints at differing product specializations and consumer preferences driving flows one way more than the other. Finally, language plays a part – shared language pairs (Dutch-Flemish, German-Austrian, Scandinavian languages) clearly boost mutual e-commerce, whereas language barriers can limit cross-border reach unless sellers localise (which not all Italian or German SMEs do as readily as Nordics). Overall, all five countries leverage the borderless EU market, but the extent of their reach and the partners they prioritize vary with their size, culture, and e-commerce sophistication.
The strength of a country’s e-commerce sector underpins its cross-border capabilities. Two useful indicators are the number of webshops per capita and the share of companies engaging in online sales. Below is a brief benchmark of the five countries:
Even as shipments cross borders, the “last mile” must cater to local preferences. Logistics firms should note that a Danish package destined for Sweden or a Dutch package to France will require localised last-mile handling – from language-specific notifications to preferred delivery methods (locker pickup, home delivery culture, etc.). Adapting delivery options to the recipient country’s norms increases success. For instance, offering Pakketboxen or parcel lockers in the Netherlands/Belgium, home delivery with SMS coordination in Germany, or convenient pickup points in Sweden/Denmark can improve customer experience. Cross-border delivery success is not just about moving goods across distance, but also navigating the “last kilometre” in a foreign context. Providers may need to coordinate returns handling across borders as well, given high return rates in e-commerce – setting up return logistics in the top destination countries can be a competitive advantage for carriers serving exporters.
In conclusion, understanding these dominant cross-border sales channels allows logistics and last-mile providers to align their networks with e-commerce trade flows. By focusing resources on key routes, integrating services regionally, and tailoring last-mile delivery to each market’s needs, providers can improve efficiency and customer satisfaction. The European e-commerce landscape is increasingly interconnected – especially within regional clusters – and logistics firms that adapt to these patterns will be well-positioned to serve both the booming cross-border volumes and the merchants driving them. Ultimately, the continued growth of cross-border e-commerce (nearly €171 billion in Europe in 2021, or ~25.5% of online revenue (ecommercenews.eu)) relies on frictionless logistics. Providers who innovate on these busy corridors will not only reduce costs but also strengthen the entire e-commerce ecosystem across Europe’s borders.
Last‑mile delivery shapes the online shopping experience, influencing conversion rates, repeat purchases and brand perception.
At Tembi, we analysed over 600,000 webshops to understand two aspects of last‑mile competition in 17 European markets, the market share of the top delivery provider and the number of distinct delivery partners each webshop integrates, and how these factors drive innovation and strategy.

Rather than estimating parcel volumes, we examined the presence of delivery providers in webshop back‑ends. Every integration represents a commitment by the webshop to offer that carrier at checkout. By counting integrations, we capture:
• Breadth of choice available to consumers
• Carrier prominence within each market
For each country - from Belgium to Slovakia - we identified the top three providers by share of webshop integrations and counted the total number of providers in active use. We excluded providers that have less than 1% market presence.

These figures show that while national postal services still lead in many markets, no single carrier dominates everywhere, and the number of options ranges from three providers in Iceland to more than twenty in the Netherlands.
We classify markets by the checkout presence held by the leading provider:
Adding the count of distinct delivery partners shows where compeition is the hightst:

Most fragmented markets, such as the Netherlands, Romania and Sweden, offer webshops a broad selection of carriers to tailor delivery options by region, price‑point and service level. In the Netherlands, for instance, there are over twenty distinct last‑mile providers active across the market. By contrast, in Iceland and Bulgaria webshops have fewer providers to choose from, simplifying management but concentrating risk, and less consumer choice. Finland sits between these extremes, with around fourteen partners in use yet Posti being present in 62% of all webshop checkouts.
Geography plays a crucial role in shaping last‑mile dynamics. In countries with vast rural areas and archipelagos - most notably Finland and Sweden - webshops need delivery partners that can reliably serve both remote villages and dense urban centres. National posts excel at this: Posti’s 62 percent presence in Finland and PostNord’s 33 percent in Sweden reflect their ability to cover every corner of the country, from Lapland to the Helsinki suburbs, or from the Stockholm archipelago to the far north. This extensive network cements their leadership and makes it challenging for smaller couriers to compete on a truly national scale.
At the same time, urban populations in these markets demand faster and more flexible options. That’s why even highly consolidated markets like Finland still see around fourteen delivery partners in use, and Sweden nearly eighteen. Specialist providers focus on city‑centre same‑day deliveries, parcel locker networks and niche eco‑services, carving out space alongside the national postal incumbent.
By contrast, in highly fragmented markets such as the Netherlands, Italy and Romania, geography is less of a barrier - population density is higher and distances shorter - so webshops routinely offer 18 to 22 different providers to meet varied consumer preferences. National posts such as PostNL and Poste Italiane must innovate continually, rolling out premium services like carbon‑neutral shipping, click‑and‑collect lockers and advanced tracking, and partnering with crowd‑shipping or on‑demand couriers to fill gaps.
In moderately consolidated markets - Denmark, Belgium, Switzerland and the Baltics - the mix reflects mid‑range geography and market size. National posts share the stage with regional specialists (such as GLS and DPD), driving innovation in service differentiation, tech integration and sustainability (electric fleets, bike couriers, offset programmes).
Finally, in smaller or more remote markets like Iceland and Bulgaria, webshops often layer core postal services with a handful (three to five) of local same‑day or on‑demand couriers to ensure coverage. Even here, national posts are expanding parcel‑locker footprints and app‑based tracking to meet rising consumer expectations - while keeping a watchful eye towards rapidly growing new digital-first ventures.
Understanding these overlapping factors - market consolidation, provider fragmentation and geographic realities - allows e‑commerce leaders to tailor last‑mile strategies. In widespread, low‑density regions, deep partnerships with national posts ensure full coverage; in dense, competitive markets, robust multi‑carrier technology and innovative niche services deliver the flexibility consumers expect.
Stay tuned for more insights and sign-up to our monthly newsletter.

The real estate sector, particularly in hospitality, is undergoing a significant shift. With growing data availability and the evolution of AI tools, companies can now make faster, more informed, and more strategic decisions. We recently sat down with Jochen Renz to talk about how he and his team are rethinking real estate development by embracing AI-driven insights.
This article is based on a conversation between Michael Bugaj , CMO at Tembi, and Jochen Renz, VP Operations Accor Switzerland & Southern Germany and Managing Director AccorHotels Switzerland.
Jochen begins by highlighting a central challenge in real estate development: identifying areas with future growth potential. "The question was, how can I ensure we define areas in a country with further potential growth than we might see today?" he explains. Traditional methods - macro- and microeconomic research, political and demographic analysis - often look backward, relying on historical data to predict future trends.
However, Jochen was looking for more than that. He wanted forward-thinking tools that could help them predict, not just reflect. This desire for a proactive approach led Jochen and his team to explore AI-powered solutions.
One of the tools Jochen explored is Tembi, a platform that helps identify emerging opportunities in different areas of cities based on continuously updated market data. While not yet rolled out in Switzerland, the tool was originally developed in Denmark and stood out to Jochen as a promising forward-looking platform.
"Tembi allowed us to do predictions in areas based on logistics, different sectors, and growing patterns," Jochen shares. "I compared this with more traditional development tools, and what stood out was its ability to look forward by analyzing data such as employer growth, financial data, and sector movements."
Traditionally, site selection was a heavily manual task involving fragmented data sources. Jochen’s team would combine macroeconomic data with localized insights, looking at street-level factors, emissions, and building potential. External consultants were often brought in to help collect and validate this information. "The consistent approach is not easy to achieve," he admits.
With AI-driven tools like Tembi, however, the potential for change is clear. While still a work in progress, the promise lies in being able to access relevant data for hundreds or even thousands of locations more quickly than before. Jochen notes that with tools like Tembi, it's becoming increasingly feasible to explore broader market patterns and opportunities in a more scalable way.
Jochen shared an example from Denmark: a promising opportunity in Odense. “I had never heard of the city before,” he laughs. “But by setting a few filters, we uncovered a significant movement in the city that revealed a growing need for hotels.”
With tools like Tembi, such discoveries become replicable. “You could look for similar movements in Sweden, Poland, or Belgium, just by changing the location input. That’s the power of structured data paired with AI.”
The ability to anticipate development opportunities earlier in the cycle will give companies a strategic edge. "If we know an area is developing and we can suggest the right brand early on, we influence the project from the beginning," Jochen explains. "That positions us in a completely different way in the value chain."
Perhaps one of the most powerful applications of AI, Jochen believes, is making complex data more accessible. "Think about someone running a 7-Eleven or Domino's Pizza franchise, they're not developers," he says. "But if AI can give them confidence in a location based on structured data, that opens up huge possibilities."
This democratization of insight, paired with AI’s ability to remove emotional bias from decisions, is transforming how Accor - and potentially the wider industry - approaches site selection.
As AI continues to evolve, Jochen envisions a future where real estate teams can monitor hundreds of markets at once, identifying trends and acting faster than ever before. “You don’t have to focus on one area anymore, you can analyze 100 areas and synthesize it down to the two best opportunities. That’s game-changing.”
The intersection of human insight and machine intelligence is reshaping real estate development. For Jochen and the team at Accor, tools like Tembi have the potential to become more than just another platform - they could evolve into essential partners in strategic growth.
As this conversation shows, the integration of AI into real estate decision-making isn't just a technical evolution, it's a shift in mindset. By empowering teams with better tools, clearer data, and broader perspectives, platforms like Tembi can help companies like Accor stay ahead in an increasingly competitive and fast-moving market.
Stay tuned for more stories like this as we continue to explore the intersection of AI and real-world strategy across industries.
or e-commerce consumers, delivery costs often represent the final hurdle before completing a purchase. Set too high, delivery fees can drive potential buyers away; priced competitively, they can boost conversions and foster customer loyalty. At Tembi, we closely track these shifts, monitoring what webshops across Europe charge consumers for different delivery methods.
We analysed webshop delivery pricing data across nine markets from October 2024 to March 2025, examining variations across three key delivery methods: parcel box, parcel shop, and home delivery.
Over 300.000 webshops are part of this analysis and we've removed the outliers when calculatin average deliver prices (free delivery and delivery of large and/or heavy objects).
%403x.jpg)
Parcel boxes have become a popular choice due to convenience and lower operational costs. However, pricing varied significantly:
Parcel shops offer flexibility for consumers who prefer to pick up orders at convenient locations:
Home delivery remains the premium service and is generally priced highest:

These shifts in delivery prices reveal strategic decisions by webshops rather than direct changes in logistics provider pricing. Webshops balance several factors:
For commercial leaders in e-commerce, understanding these pricing strategies is critical. Lower delivery prices may indicate aggressive market positioning or efficiency gains, while increases might signal tighter operational conditions or reduced competition.
Webshop delivery pricing is a powerful indicator of market conditions and consumer expectations. Regular monitoring of these shifts is essential to stay competitive and agile - regardless if you're a retailer selling directrly or inderictly, or operate a last-mile delivery provider.
hen evaluating market opportunities, many look at total size. But total size doesn’t tell you where momentum is building. New webshop creation - and survival - is often a better indicator.
Despite being considered mature digital markets, across Denmark, Sweden, Finland, Norway, and Iceland, 9,200 new webshops were launched in 2024 that are still active today. That’s not total launches, that’s survivors - which gives a better sense of which markets are currently supporting new players.
This challenges conventional wisdom about market saturation and highlights untapped opportunities in the region.

Sweden leads with the strongest growth, showing a 42% increase in the number of newly launched webshops that remain active compared to the previous year. Close behind is Denmark, with a 39% year-on-year growth. These figures suggest that both markets are currently fertile ground for e-commerce newcomers, despite heightened competition and shifting consumer behaviour.
Finland and Iceland also recorded positive, albeit more modest, developments. Finland saw a 14% increase in surviving new webshops, while Iceland posted 13% growth. These numbers may not be as dramatic as Denmark or Sweden, but they still point to a healthy pace of new market entrants that are finding ways to stay afloat.
Norway, by contrast , is the only market that moved in the opposite direction. Here, the number of newly launched webshops that remained active declined by 2% compared to the previous year. While not a steep drop, it stands out in a region otherwise trending upwards. This downturn was primarily concentrated in one category - Beauty & personal care - which appears to have experienced a wave of closures (more details on this in our previous blog post available here).
The contrast between countries suggests that, even within a shared economic region, local market dynamics and category-specific pressures can lead to different outcomes.
At first glance, it may seem contradictory: high closure rates alongside a surge in new webshop launches. Between August 2024 and February 2025, over 3,300 Danish webshops ceased activity. That’s 11% of the total market, gone in just six months. This might suggest a market in retreat struggling with saturation. But the full picture tells a different story.
In the very same period, 2,645 new webshops were successfully launched and remained operational. These aren’t just test stores or dormant domains. These are active webshops that made it past the initial setup phase and into actual trade.

One of the more common assumptions about Nordic e-commerce is that the market is saturated. With strong category leaders and high consumer expectations, it can appear that there is little room left for new entrants. However, the consistent entries of still active webshops launched in 2024 challenges that thinking.
These are not just short-lived experiments or weekend projects. They are businesses that have managed to find customers, generate sales, and carve out a place in the market.
In addition, sustainability is playing an increasingly influential role in shaping consumer choices. According to PostNord’s 2024 report, 8 out of 10 Nordic shoppers consider sustainability when making purchases. This creates space for newcomers with strong brand values, circular business models, or second-hand offerings, which are becoming more popular particularly in fashion.
This also presents strategic opportunities for established brands. The new entrants create a pipeline of potential partners, collaborators or acquisition targets. For incumbents, this is a chance to stay ahead of the curve by aligning early with brands that may become the next category leaders.
For entrepreneurs, the lesson is that everything is still very much possible. While competition is strong, the path to growth remains open to those with a clear proposition answering real customer needs. Differentiation, specialization, and a willingness to build something that doesn’t look like everything else on the market will again prove to be key advantages.
Rather than signaling saturation the current trends reflect a dynamic market. New players continue to reshape what is possible, and the space for innovation remains open.
At Tembi, we track over 600,000 webshops across Europe, updating our database bi-weekly to gather historical data and monitor the development of each webshop.
Most of us can name the biggest online retailers—but what about the thousands of smaller webshops that make up the real fabric of e-commerce? In Denmark alone, a country of just under six million people, there are over 30,000 webshops actively selling products online. And if we include service-based and other categories, the number climbs beyond 40,000.
That prompted us to ask: how many of these webshops are actually surviving?
By comparing webshop and company data from August 2024 to February 2025, Tembi identified over 3,300 webshops that had ceased activity. That represents 11% of the total market - a significant churn, even if mostly made up of small to medium-sized players.
In the last 6 months in Denmark:
This does not signal an 11% drop in e-commerce overall, but it does indicate high volatility - particularly among smaller players.

Looking at category distribution, Clothes and Shoes make up 13.2% of all Danish webshops, followed by Furniture at 10.2%.
When we analysed closures, the category that took the biggest hit was also Clothes & Shoes, with 530 webshops closed - accounting for 16% of all closures. Beauty & Personal Care and Furniture followed, with around 170 closures each.
This aligns with overall category size: more webshops in a category generally mean more closures. But fashion clearly over-indexes in both size and risk.

Fashion e-commerce is fiercely competitive. Dominated by global players and shaped by constantly shifting consumer preferences, it also faces the operational challenge of seasonal inventory cycles.
To stand out, local brands need a differentiated marketing approach. But with advertising costs rising sharply, that’s easier said than done. It’s not uncommon for B2C fashion stores to increase their spend by 20% just to maintain business-as-usual - often still being outbid by global giants. This forces a tough choice: either reach fewer customers or spend at unsustainable levels.
Add to this the so-called Temu effect. Chinese dropshipping marketplaces like Temu use aggressive, loss-leading strategies to offer ultra-low prices. Danish webshops can’t compete without sacrificing quality or profitability. Even environmentally conscious shoppers can be swayed by endless product options at rock-bottom prices.
Each of these pressures is significant on its own. Together, they create a perfect storm of market conditions that are difficult for local fashion players to survive.
While furniture hasn’t been hit by dropshipping platforms in the same way, it faces a different challenge: logistics.
Shipping large, heavy items is expensive. Rising freight costs in 2024 made margins even tighter. Add in the complexities of delivery windows, assembly services, and returns, and it becomes tough for smaller players to compete with established brands that can absorb those costs or optimise operations at scale.
While we can't say shipping prices are solely to blame for rising closure rates in this category, they are a critical factor impacting profitability.

With over 50% of Danish consumers buying clothing online, and nearly 40% purchasing shoes, these categories are massively popular—and saturated.
Not every webshop can survive in such a crowded, price-sensitive market. Despite relative economic stability, consumer confidence in Denmark remains cautious. Reports from BCG and Nordea show low discretionary spending, which hits fashion and beauty especially hard.
An 11% closure rate may sound alarming, but it’s not entirely surprising. Tools like Shopify and WooCommerce have made it incredibly easy to launch a webshop - sometimes in less than a day. But low barriers to entry also mean low resilience. The easier it is to start, the easier it is to fail.
While a few large retailers have gone under, our data suggests that the majority of closures come from small and medium-sized businesses.
Still, it’s not all bad news. Over the same period, 2,645 new webshops were successfully launched. So while the market is churning, it’s also replenishing.
E-commerce is dynamic, and understanding it requires continuous tracking. At Tembi, we monitor 600,000+ webshops across Europe, updating our database bi-weekly. This enables us to:
Because in a market that never stands still, real-time intelligence is your competitive edge.
hen we talk about e-commerce opportunity, the conversation often starts, and ends, with the size of a market. How many webshops are there? Which countries have the highest absolute numbers?
At Tembi, we believe that raw totals only tell part of the story. To really understand where e-commerce is thriving, and where it’s just starting to take hold, you need to look at density, digital integration, and market readiness.
We recently analysed data across 20+ European countries, looking not only at total webshop numbers but how they compare to population size and national business ecosystems.
Some of the results are surprising:

Knowing how many webshops exist per capita or per company tells us more than just the size of the e-commerce sector. It signals how deeply online sales are embedded into the economy.
For commercial teams, this is essential context. Are you entering a market where most companies already sell online? Or one where there’s room to help businesses go digital? Are you facing established competitors, or discovering a still-fragmented field?
This kind of intelligence can shape your go-to-market plan, sales motions, and even your product localisation strategy.
In short: don’t just look at the number of webshops. Look at who they serve, how they scale, and how densely they operate within the economy. Because the future of e-commerce isn’t just about growth -it’s about depth, integration, and staying power.
n commercial real estate, having the right insights can lead to valuable opportunities. Tembi's new report, "Netherlands Relocation Data & Predictions 2025," offers practical understanding and insights into upcoming shifts in the commercial real estate space.
Tembi’s AI-driven analytics blend market dynamics, employment patterns, and historical data to deliver accurate and reliable market forecasts.
Our analysis highlights 9,993 companies in the Netherlands likely to relocate during 2025, potentially affecting over 222,000 employees. Another 21,532 companies might also move offices within the next year, impacting nearly 700,000 employees.
Showing a clear understanding of local trends can enhance your credibility with clients. Our report details areas gaining or losing businesses, like Utrecht, Amsterdam-Duivendrecht, and Rotterdam. This information can help you deliver pitches that clearly match your clients' strategic interests.
Download the report today to stay informed about relocation trends, helping you anticipate market changes, uncover new opportunities, and stay ahead in your field.
Get the full report: Netherlands Relocation Data & Predictions 2025
Are you interested in getting more data and see how Tembi can you help you grow, talk to our sales team.
e’re excited to share that Tembi has officially launched in Germany, bringing our e-commerce intelligence to one of Europe's largest markets. With Germany now on board, Tembi covers 17 markets, offering commercial teams actionable insights to drive strategic decisions and accelerate growth.
At Tembi, our approach goes beyond basic data collection. Over the past month, our system has visited and analysed more than 500,000 websites, systematically verifying each one. Through this process, we identified and validated over 94,800 genuine, operating webshops - ensuring that our insights are based on high-quality, accurate data. Each webshop is individually assessed, capturing detailed insights into their operations, product offerings, and category performance. This level of precision provides commercial teams with unmatched visibility into Germany’s e-commerce landscape, helping them pinpoint exactly where to focus their efforts - whether strengthening their local presence or expanding internationally.

Our robust intelligence monitors the technology stack of webshops, including commerce platforms like Shopify, WooCommerce, Shopware, ePages,AVADA, and Magento, as well as other software solutions they use. This empowers businesses with clear insights to strategically optimise their tech infrastructure and drive growth.
Tembi’s comprehensive analysis of the German market includes:
• Last-mile delivery marketshare - identifying logistics providers, delivery methods and prices for every webshop.
• Tracking of payment providers used by webshops, including PayPal, Klarna, Google Pay, Apple Pay,Sofort, Shopify Pay, ShopPay, and Opay (and many others).
• Webshop growth data andproduct sold, revealing emerging market trends and growth opportunities.
This launch highlights Tembi's dedication to delivering verified, actionable e-commerce intelligence that helps commercial teams proactively identify growth potential and optimise their strategies in Germany and beyond.
Keep an eye out for future updates, insights, and trends straight from Europe's e-commerce hub.
Want to know more? Reach out to our sales team.
In the early 2000s, Open Innovation emerged as a response to the Not-Invented-Here(NIH) Syndrome - a mindset particularly prevalent in engineering and IT organisations.Companies often preferred to build their own solutions rather than adopting existing ones, even when viable alternatives were readily available.
The rise of open innovation, open source, and open data has since accelerated technological progress for everyone. Instead of investing heavily in developing proprietary solutions, businesses can now leverage what already exists, saving time, money, and effort.
Despite these advancements, some businesses still choose to develop their own versions of existing solutions. The reasons often include:
However, these assumptions often lead to inefficiencies and long-term challenges.
If a solution already exists in the market, trying to replicate it internally is rarely the best approach. Here’s why:
Once a company has invested in a proprietary solution, it becomes difficult to abandon, even when it’s no longer efficient. This is how businesses end up with a giant with feet of clay, a fragile system that limits agility and innovation.
Rather than building something from the ground up, focus on what differentiates your business. If a solution already exists in the market, build on top of it rather than duplicating efforts. The key to staying competitive isn’t in owning every piece of technology, it’s in leveraging the best tools available to drive your core business forward.
s we look ahead to 2025, our CEO Kristian Mørk Puggaard and CMO Michael Bugaj have identified five intelligence trends looking to transform how organisations approach data, analytics, AI, and strategic decision-making. From the increasing demand for tailored intelligence to the early days of AI “colleagues,” these predictions underscore the continuously growing importance of innovation in staying competitive.
Whether you’re seeking to use open data, explore agentic AI, or simply make the most of emerging cloud technologies, we hope these insights spark new ideas and guide your next steps. Dive into our Five Intelligence Predictions for 2025 to discover how you can proactively prepare for, and thrive in, the evolving landscape of intelligence.
Skyrocketing demand for tailored intelligence
As off-the-shelf solutions lose their edge and general solutions built on scraping and simple analytics fail to provide sufficient depth, businesses will demand insights custom-fit to their use cases, ushering in a new era of specialised intelligence to stay ahead of the competition.
Many organisations are interested in understanding and tracking market trends to gain broader insights. However, as business leaders, we seek actionable intelligence within our own domains. As we realise what is possible, and as trust in AI-based solutions grows, the demand for use-case intelligence will surge exponentially.
We’re already seeing AI reshape workflows, but in 2025 it will become a core differentiator in business models—unlocking deeper insights, driving strategy, and delivering more profound value than ever before by empowering organisations to incorporate advanced intelligence across their operations.
The power of Open Data ecosystems
AI requires data to be truly effective. Initiatives like the European Data Act and Overture Maps signify a shift towards freely available data, leading to new business opportunities and collaborative innovations across industries. With the EU Data Act expected to become applicable in 2025, more data will be made available for use by the broader economy and society, while ensuring companies and individuals who generate the data remain in control.
With an increase in both the quantity and quality of available data - at a lower cost - small and medium-sized enterprises (SMEs) will be better positioned to leverage that data in their decision-making processes.
Agentic AI and our first AI colleagues
By 2025, we’ll see AI colleagues enter our work environment. AI assistants will progress beyond data crunching and GPT-driven solutions to orchestrating tasks and decisions - enabling professionals to tackle complex challenges with unprecedented precision and speed.
New roles will arise to oversee agentic systems and manage AI assistants. AI is already viewed as a commodity, and with the ability to build systems in which AI agents collaborate with one another, organisations will begin creating human processes around AI, including entire roles managed by AI.
Growing Dependence on External Data
As data becomes the lifeblood of strategic decision-making, organisations will rely on ever broader and more diverse external datasets. The skill to source, curate, and interpret these data volumes will be a critical competitive advantage.
Real-time market monitoring will play an even greater role in decision-making. New vendors will emerge with highly specialised datasets will challenges traditional data to keep their datasets up to date, while predictive models will help fill the gaps - shifting us from yearly monitoring to more frequent and immediate updates.
Cloud & AI for everyone
Thanks to ongoing technological advancements and cost efficiencies, cloud-based AI services will become more accessible—and more affordable—allowing organisations of every size to benefit from sophisticated intelligence solutions.
NVIDIA, for instance, with their project DIGITS, will offer a personal AI supercomputer that can pack 1,000 times the power of an average laptop, bringing high-performance AI computing to individual users. Small and medium-sized enterprises, just like international enterprises, can now train their private AI in secure environments - integrating both internal and external data. This will pave the way for digital twins of their markets and the ability to simulate different outcomes.
What's your take on the intelligence space for 2025?

Clerk.io is a leading e-commerce personalisation platform, helping thousands of webshops optimise their customer experience through tailored product recommendations, search, and email personalisation.
Clerk.io needed to address two main challenges:
Christian, Head of Lead Generation at Clerk.io, explained: “We were looking for a solution to scan markets and get a clear understanding of their potential. At the same time, we needed to ensure the leads we pursued met specific criteria, like being transactional webshops. Our previous provider couldn’t consistently deliver on these fronts.”
Clerk.io turned to Tembi to tackle these challenges. With Tembi's market data & intelligence, the team gained access to:
Christian highlighted the impact: “Tembi gave us a market feeling. For example, in Norway and Sweden, we could see the potential and decide if this was something we should double down on. The data helped us make informed decisions about where to focus our sales efforts. And 98% of the leads we identified via Tembi were qualified, allowing us to focus on high-quality opportunities without loosing time on irrelevant prospects.”
1. More Accurate Leads. By leveraging Tembi's validation process and advanced filtering tools, Clerk.io increased the accuracy of its leads.Only 1% were unqualified, and another 1% didn’t match the ICP criteria.
2. Time savings. Manual qualification time was massively reduced, allowing the team to allocate resources more effectively.
3. Market viability assessments. Clerk.io used Tembi to assess markets likeNorway and Sweden, deciding where to prioritise their efforts for maximum growth potential.
“Tembi made qualifying leads less time-consuming, and the time savings alone justified the investment,” said Peter, Head of Marketing at Clerk.io.’
Beyond the technical aspects, Clerk.io found their collaboration with Tembi to be seamless and productive. Peter Tullin, CMO at Clerk concluded: “We’ve been very happy with Tembi. It was a seamless collaboration, and their local Copenhagen office made it even easier to work together.”

embi has secured a €3 million investment from Seed Capital to grow our market intelligence platform and expand our market reach.
The post below is a translation of a news article posted by ITWatch the 5th of December 2024 by journalist Tobias Krog Vind.

Market Intelligence Platform Secures Seed Investment: "We Believe This Will Be the Way Companies Work in the Future"
Tembi has just received a capital injection of DKK 22 million from Seed Capital. This marks only the beginning for the company, which aims to set the agenda for the future of market analysis through AI.
In a rapidly changing market, keeping up with emerging trends can be challenging, especially in a landscape with thousands of businesses and even more products. Forecasting developments adds another layer of complexity.
The Danish market intelligence platform Tembi, however, claims it can provide AI-generated insights tailored to the realities of each individual company.
Using image recognition, language models, and machine learning, Tembi's AI aggregates data from various sources and presents it as market analyses in clear graphs and actionable insights. Customers can manipulate the data and graphs as needed, customising the platform to fit their requirements.
“We enable our customers to predict market movements, helping them stay ahead of their competitors. At the same time, our services also support them in actively leveraging these insights in their strategies and execution,” says Kristian Mørk Puggaard, CEO of Tembi.
For example, Tembi's solution provides insights into trade and logistics patterns within e-commerce and retail, including which webshops and product categories are growing in a given country and which companies are experiencing the most robust growth.
“It’s crucial for a company's success to know what’s happening among competitors and customers within their product group. Our tool makes it easier—and far less resource-intensive—to stay updated,” adds the Tembi CEO.
The two-year-old market intelligence platform, which currently serves 50 customers across 14 European countries, has raised DKK 22 million from Seed Capital in its latest funding round.
According to Kristian Mørk Puggaard, the timing of the investment aligns with Tembi's rapid growth and the opportunities available, but it also requires immediate action to capitalise on them.
“To be the first to dominate this market in Europe, we need to act now. In a few years, I believe everyone will demand a platform like ours. We believe this is the way companies will operate in the future. To ensure we’re the ones delivering it, we want to accelerate our growth now,” he explains.
“It was clear they understand what we are building and the future we’re targeting. It’s vital for us to have partners who ask the challenging questions that push us to rethink what we might otherwise take as established truths,” says Puggaard.
He also highlights Seed Capital's network and strong reputation as decisive factors, enabling Tembi to take its next steps.
The next step for Tembi is to grow its customer base beyond Europe’s borders, which the company plans to achieve within the next two years.
“We aim to be on the radar of all leading companies, not just in Europe but on other continents as well. While we haven’t finalised the exact location, North America seems like a strong candidate,” says Puggaard.
Additionally, Tembi plans to expand its client portfolio, which is currently concentrated in logistics, trade, and real estate.
Given this trajectory, Puggaard anticipates that the company will be ready for another funding round within one to two years.
he Nordic eCommerce report dives into the eCommerce market in Sweden, Finland, Norway and Denmark. The report is free and available for download here.
Looking into data from 79.000 online retailers that sell physical goods we analysed what type of commerce platforms are popular, which payment providers are mostly used as well as delivery methods and product categories.
Interested in knowing more about our data, or are you looking to reach a specific type of webshops? Contact our sales here for a short intro.

Baltic E-Commerce Market Intelligence Report (Published January 2024)
Nordic e-commerce Market Intelligence Report (Published October 2023)
hen starting a webshop, you have two options: build a custom site from scratch or choose a ready-to-go commerce platform to manage inventory and sell products or services online. Given that webshops have existed since the early days of the internet, there are now numerous providers catering to both entrepreneurs and established businesses.
A variety of commerce platforms power European webshops, from large international providers like Shopify and WooCommerce to smaller local specialists such as Dandomain in Denmark and Voog in Estonia. Larger platforms often offer the benefits of scale, while local providers might offer specialized solutions and compliance with regional regulations that enhance scalability.
Choosing the right platform is not just important for those building webshops, but also for the ecosystem surrounding commerce platforms. Not all plug-ins and solutions are compatible with every framework, and understanding a platform’s market penetration can be a strong indicator of its success and investment in that region.
In this article, we take a deep dive into the most widely used commerce platforms across 10 European markets, examining which solutions are the most popular. It’s likely no surprise that Shopify and WordPress’s open-source WooCommerce plugin dominate, but who are the other key players?

Looking at Switzerland, The Netherlands, Slovakia, Denmark, Finland, Sweden, Norway, Lithuania, Latvia and Estonia we’ve identified a total of 242.061 active webshops. With over 100.479 webshops, or 32%, Shopify is trailing behind WooCommerce with 9%. Looking at these 10 markets, WooCommerce is today the preferred e-commerce platform with around 129.480 webshops.
The fact that we only identified 6.682 custom-built webshops (2,1% of the dataset), shows just how powerful commerce platforms are today, where both large and small webshops can benefit from the platform's investments in technology and solutions that make it easy, and possible, to operate and grow a business online.
Before diving into the specifics of each market’s platform penetration, let’s quickly explain how we gather and maintain the quality of this data.
Monitoring hundreds of thousands of webshops on an ongoing basis demands a robust validation process to maintain high-quality data. At Tembi, we automatically filter out inactive webshops, businesses in bankruptcy, and webshops not registered as official companies, and we can only to this by actually visiting the webshops and analyze their operations continuously. We’re not B2B lead list generation company per se, but our data is used by many companies to improve sales and help identify business opportunities.
Once the validation process is complete, and we’ve analyized the webshops products, our system categorizes each webshop into a product category and enriches the data with for example website traffic data and company data.
If you're interested in learning more about how our technology works, be sure to check out our article: Insights from every Webshop on the Market
Having looked how the distribution looks over 10 European countries, let’s examine which E-Commerce platforms are popular in each country and see what insights we can uncover into regional preferences and market trends.

In Denmark, we can find a total of 32.720 webshops. We have identified that 13.567 webshops are built using WooCommerce, and 11.703 are built with Shopify. Just as it also shows in the picture of the ten European markets, WooCommerce and Shopify power the majority of the webshops. The remaining 24% (7.450 webshops) utilize various other providers. With 2.164 webshops, Dandomain stands as the third most used platform in Denmark, likely due to its local roots and strong integration with popular hosting services in the country.

Estonia has a total of 8.568 webshops, with WooCommerce as the clear market leader. WooCommerce is used by 5.846 webshops, representing 68% of all Estonian market. In second place, like in most markets, Shopify follows, but with only 9% of the market, totaling 739 webshops. WooCommerce’s strong presence in Estonia gives it the highest market share in the group of the analysed countries. In third place we find the local e-commerce platform, Estonian Voog, powering 570 webshops. Voog offers native language support and is perfect for small to medium-sized companies, which could also explain why WooCommerce owns such a big portion of the market.
The remaining 23% of E-Commerces, without the ones using WooCommerce and Shopify, are built using various other providers (1.983 webshops).

Finland has a total of 15.092 webshops, with WooCommerce and Shopify being the market leaders. 6.953 webshops in Finland use WooCommerce (45% of the Finnish market), while Shopify is used by 4.014 webshops, accounting for a 26% market share.
The remaining 28% (4,125 webshops) utilize various other providers. Notably, 644 webshops (5% of the market) are custom-built, highlighting a segment of businesses opting for fully tailored E-Commerce solution. With a strong tech and design culture, Finnish businesses likely leverage local expertise to create bespoke solutions cater directly to their target market. MyCashFlow, a Finnish E-Commerce Platform, is the third most used one in the country, accounting with 1.327 webshops, a 9% of the total.

There are 4.903 webshops in Latvia. Of this number, 1.841 webshops are built with WooCommerce (37% of Latvian webshops) and 1.201 webshops are built with Shopify (24%). The other 1.861 webshops (38%) use different providers.

Lithuania has a total of 12.077 webshops, with WooCommerce as the most popular platform, powering 6.568 stores, or 55% of the market. Shopify is the second most used (2.198 webshops) making up 18% of Lithuanian online stores. The remaining 26% (3.311 webshops) use various other providers, with PrestaShop ranking third, supporting 1.506 webshops and capturing 12% of the market. As we can see, PrestaShop ranks very closely to Shopify. We see how two Lithuanian E-Commerce platforms, such as Shopiteka and Verskis, are too the most used ones.

The Netherlands have a highly developed E-Commerce market with 81.224 webshops. WooCommerce has by far most clients, powering 38,316 stores, or 46% of all online shops. Shopify follows with 21,534 webshops, accounting for 26% of the market. The remaining 27%, or 21.374 stores, are distributed across various other providers.

Norway has an E-Commerce market with 13.469 webshops. WooCommerce leads the way, powering 5.346 webshops, or 39% of the market. Shopify is a close second, used by 4.931 webshops, making up 36% of the market. The remaining 24%, or 3.192 webshops, utilize various other providers. The competition between Shopify and WooCommerce is tight in Norway, with only 415 webshops more (a 3%) built with the latter. The third one is MyStore, an E-Commerce provider created in Norway.

There are 15.429 webshops in Slovakia. WooCommerce leads the market, powering 6.399 of these webshops, accounting for 41%. Shoptet follows with 3.502 webshops, making up 22% of the market. The remaining 36%, or 5.528 webshops, are built using a variety of other providers. Slovakia’s case is specially interesting, as Shopify is not the second choice. In its place we find Shoptet, a Czech platform that offers marketplace integrations to the Central European market. This can be relevant for companies looking to increase visibility and brand recognition in the region.

Sweden's E-Commerce landscape is strong, with a total of 31.588 webshops. WooCommerce has a solid position on the market, powering 13.293 of these stores, or 39%, showcasing its popularity among Swedish businesses. Shopify isn’t far behind, with 11.354 webshops, making up 34% of the market. The other 6.941 webshops, representing 26%, use a variety of different providers. We find similar data in Norway, the competition between WooCommerce and Shopify is close, with only a 4% market share of difference (roughly 2.000 webshops).

Switzerland is home to 26.991 webshops, with WooCommerce and Shopify leading the market. 12.168 of these webshops are built with WooCommerce (45% market share), making it the most popular E-Commerce platform in the country. Shopify follows closely, with 9.841 webshops, representing 36% of the market. The remaining 19% (4.739 webshops) are built using different providers. Of the most used platforms in Switzerland, only PepperShop is Swiss company.
The data from analyzing 242.061 webshops confirms that WooCommerce and Shopify hold a dominant position, commanding 73% of the market share. Breaking this dominance is no easy task, as it would not only require mass migration but also new solutions that offer greater value than the globally leading commerce platforms.
However, despite the dominance of these major providers, there are still over 80.000 webshops using other frameworks. For instance, with over 15,000 webshops on PrestaShop and more than 13,000 using Magento, there remains a significant opportunity to develop plug-ins and solutions for these platforms.
Whether you're developing plug-ins or building software reliant on specific frameworks, understanding your total addressable market (TAM) is a key indicator of potential and helps determine if an investment is worthwhile. Additionally, knowing how different markets are penetrated provides insights into where to focus future sales and marketing efforts. The more data you have, the better informed your decisions will be.
If you’re interested in more data around the webshops, don’t hesitate to contact us on hello@tembi.io. We are adding more countries continuously so sign up for our newsletter to get the latest updates.
he amounts of available data is growing in an overwhelming speed, on one hand presenting an increased difficulty to collect and access the data, on the other hand an increased opportunity to better understand markets and competitors.
With continuously increased computing power and a steadily growing democratisation of access to advanced analytics, the way we approach decision-making is evolving. What has been historically a process of intuition and experience is now increasingly guided by data-driven insights. This transformation is enabling companies to not only understand past and present trends but also to predict and shape future outcomes.
Let’s dive into how data and analytics are reshaping business decision-making, from traditional methods to the advanced analytics techniques of the future.
Traditionally, business decisions were often made based on intuition, experience, and a limited set of data. Executives relied heavily on their gut feelings or the historical knowledge of their industry. While this approach worked in the past, it more than often led to suboptimal outcomes due to the lack of comprehensive information and understanding of the market.
The emergence of data-driven decision-making marked a significant shift in this process. Businesses began to collect and analyse large internal and external datasets, to inform their strategies and tactics. A development that has been rapidly accelerated by the introduction of BI software. Decisions were no longer solely based on instinct but were supported by quantitative evidence.
As technology advanced, so did the decision-making process. We have now entered an era of analytics-driven decisions, where businesses use sophisticated analytical tools to forecast future trends (predictive analytics) and even prescribe specific actions to achieve desired outcomes (prescriptive analytics). For instance, Amazon uses predictive analytics to manage inventory, ensuring that products are in stock when customers want them while minimising storage costs. Our company, Tembi, has developed a beta product that uses prescriptive analytics to recommend development and construction companies what to build in certain locations to reach full capacity. And this is the only beginning of how data and analytics will assist us in making better decisions.

To understand the full impact of analytics on decision-making, it’s essential to explore the concept of the Analytics Value Escalator developed by Gartner. This model describes the progression of analytical methods, each offering increasing value and complexity.
1. Descriptive Analytics
Descriptive analytics answers the question, “What happened?” It involves summarising historical data to understand past performance. For example, sales reports, web analytics, and financial statements fall into this category. While descriptive analytics provides valuable insights, it is often limited to hindsight and does not explain the reasons behind the data.
2. Diagnostic Analytics
Diagnostic analytics delves deeper, addressing the question, “Why did it happen?” By identifying correlations and patterns within the data, businesses can uncover the root causes of specific outcomes. This method is more powerful than descriptive analytics but still focuses on past events.
3. Predictive Analytics
Moving up the escalator, predictive analytics answers the question, “What is likely to happen?” It uses historical data, machine learning algorithms, and statistical models to forecast future trends and behaviors. For example, retailers might use predictive analytics to anticipate customer demand or optimise inventory levels.
4. Prescriptive Analytics
At the top of the escalator is prescriptive analytics, which addresses the question, “What should we do?” This advanced method not only predicts future outcomes but also recommends specific actions to achieve the best possible results. For instance, a logistics company might use prescriptive analytics to determine the most efficient delivery routes, considering variables like traffic, weather, and fuel costs.
No matter how advanced the analytics methods are, their effectiveness is fundamentally dependent on the quality of the data they analyse. Poor quality data or analytics conducted on incomplete data-sets can lead to misleading conclusions and can hence create unreliable insights.
Common data issues include data silos, where information is trapped in isolated systems; inconsistent data formats; and incomplete or outdated data.
To ensure data quality, businesses must adopt best practices such as regular data cleaning, integration across departments, and robust data governance policies.
For instance, Procter & Gamble invested in a comprehensive data governance framework to ensure consistency and accuracy across its global operations, which has been crucial in maintaining the integrity of their analytics initiatives.
“We’re also now able to take our data analytics and AI to the next level because we have a solid, reliable base of product data that can be matched with external consumer data. That possibility gets our business leaders really excited!”
Laura Becker, President of Global Business Services at Procter & Gamble
Generative AI, a cutting-edge technology that enables machines to create new and original content, has revolutionised various industries by producing text, images, music, and even complex data patterns. Its ability to generate content that mimics human creativity has opened up exciting possibilities in fields like marketing, design, entertainment, and more. However, despite its remarkable capabilities, generative AI faces notable limitations, particularly in the context of business decision-making.
In business environments, decision-making often requires a deep understanding of nuanced contexts, the ability to interpret complex and sometimes ambiguous data, and the capacity to foresee the broader implications of certain choices. While generative AI can assist by providing insights, generating scenarios, or offering creative solutions, it lacks the human intuition and judgment needed to fully comprehend the strategic, ethical, and long-term consequences of business decisions.
Another significant limitation is the lack of transparency in how generative AI models arrive at their outputs. These models often function as "black boxes," where the decision-making processes are not easily interpretable or understandable, even to those with technical expertise. This opacity can be problematic in business settings, where leaders need to understand the rationale behind decisions and recommendations. Without transparency, it becomes challenging to trust and validate the AI's outputs, increasing the risk of relying on potentially flawed or biased information. For example, in finance, where decisions can have significant consequences, the lack of transparency in generative AI’s recommendations might lead to regulatory concerns.
Moreover, generative AI relies heavily on the quality and scope of the data it has been trained on. If the training data is biased, incomplete, or not representative of the current environment, the AI’s output may be flawed or misleading. This can be particularly problematic in business, where decisions based on inaccurate or biased data can lead to significant financial losses, reputational damage, or other unintended negative outcomes.
Looking ahead, prescriptive analytics is set to further transform how businesses make decisions, enabling them to be more proactive and confident in their choices. By processing large amounts of data—both historical and real-time—using advanced algorithms, prescriptive analytics not only analyses past events and predicts future trends but also recommends the best actions to take. This empowers everyone in an organisation, from managers to frontline employees, to make quicker and more informed decisions.
For example, industries like healthcare, finance, and supply chain management are already beginning to harness the power of prescriptive analytics. In healthcare, it can optimize treatment plans for patients by analyzing a wide range of factors, from medical history to genetic data. The Mayo Clinic is one institution exploring how prescriptive analytics can personalise treatments that hopefully can lead to better patient outcomes and reduced costs. By using simulations, companies can test different strategies in a virtual environment before implementing them, ensuring that decisions are more likely to lead to successful outcomes.
A key advantage of prescriptive analytics is its ability to combine internal data with external market intelligence. By integrating data from sources like customer feedback, industry trends, and competitive analysis, businesses can gain a more comprehensive view of the environment in which they operate. This broader perspective allows companies to better understand market dynamics, customer needs, and emerging opportunities. When internal data is enriched with external insights, businesses can make more informed decisions about where to allocate resources, how to optimise operations, and where to focus strategic efforts. This combination of internal and external data enhances the ability to deploy resources effectively, ensuring that efforts are aligned with both internal capabilities and market demands.
However, not every company will immediately or fully adopt prescriptive analytics. The extent to which businesses can leverage this technology depends on the quality of their data, the sophistication of their existing analytical capabilities, and their willingness to embrace advanced analytics. Companies with strong internal data and analytical resources will be the first to take full advantage of prescriptive analytics. In contrast, smaller businesses or those with less advanced data strategies may begin with specific applications and gradually expand its use. Alternatively, they can utilise Intelligence-as-a-Service providers such as Tembi to gain access to market data, analytics, and actionable insights, allowing them to benefit from advanced analytics without the need for extensive in-house capabilities.
The success of prescriptive analytics also hinges on the quality of internal data and the company’s analytical skills. To implement it effectively, businesses need to ensure their data is accurate, comprehensive, and up-to-date, requiring investment in data management and infrastructure. Skilled data scientists and analysts are essential for developing and maintaining the models that drive prescriptive analytics. Moreover, fostering a data-driven culture within the organisation is crucial, so that decision-makers understand and trust the recommendations provided by these tools.
As prescriptive analytics becomes more widespread, companies must also consider the ethical implications of relying on these advanced technologies. The potential for algorithmic bias, the need for transparency in decision-making processes, and concerns around data privacy and security are all critical issues, especially in industries handling sensitive information. Businesses will need to strike a balance between leveraging the capabilities of prescriptive analytics and maintaining human oversight to ensure responsible and effective decision-making.
The journey from traditional decision-making to an analytics-driven approach represents an important evolution in the business world. As data and analytics continue to advance, businesses are better equipped than ever to make informed, strategic decisions. However, the effectiveness of these decisions depends on the quality of the data, the appropriate use of analytical methods, and a clear understanding of the limitations of emerging technologies like generative AI.
To navigate this new landscape, businesses should consider the following steps:
Audit your data quality: Ensure that your data is clean, integrated, and well-governed.
Invest in analytics training: Equip your team with the skills needed to leverage advanced analytics tools.
Balance AI with human judgment: Use AI tools like generative AI and prescriptive analytics wisely, keeping human oversight in place.
As we look to the future, prescriptive analytics offers a promising glimpse into how businesses can navigate an increasingly complex world with confidence and foresight. By embracing these tools and strategies, companies can stay ahead of the curve and achieve sustained success in a data-driven world.
For further reading, consider exploring the ethical challenges of AI in business or case studies on successful data-driven decision-making in various industries.
Invitation for Discussion: How are you incorporating analytics into your decision-making process? What challenges or successes have you experienced? Share your thoughts with us at mbu@tembi.io.
s we approach the year's final quarter, the stakes for last-mile delivery companies couldn't be higher. With the majority of revenue generated from B2C webshops, Black Friday, Cyber Monday, and the Christmas season represent crucial opportunities to maximise profits.
However, preparation for these peak periods involves more than ramping up staff, fine-tuning routing, and increasing throughput.
At Tembi, having helped over 40 last-mile providers across Europe, we understand that strategic planning on the commercial side can make or break your Q4 performance. To help you in the process we have collected a five of our key learnings on the topic.
Instead of focusing solely on acquiring new clients, ensure you're optimally positioned with your existing ones. Monitoring your position in their checkout process can yield significant returns. Being positioned as the top delivery provider at the delivery checkout can dramatically increase the number of orders you receive, often doubling or even tripling them.
From several of our Last-mile delivery clients, we have witnessed an average of 30%-50% increase in top-1 rankings working tactically with this. Typically, this amounts to a total increase of 20%- 33% in revenue from the existing client base!

Strategic client acquisition is essential. Focus on attracting webshops that boast a strong infrastructure, high order volumes, and the right geographical locations that align with your logistics.
These targeted efforts can significantly enhance your profit margins and operational efficiency.
On the other hand, failing to identify the clients that are right for you means losing time and money on unsuccessful outreach, attending irrelevant meetings, and seeing your closing rate decline. And even worse, potentially attracting a non-profitable client for your business.
Market research or a good market insight & sales intelligence tool will help ensuring you target the right clients. More is not always better.

Understand where you stand out compared to your competitors and highlight your unique selling points to differentiate yourself in a crowded market. Are your delivery times faster? Do you offer more sustainable options? Is your service reliability superior?
Tembi’s E-commerce Market Intelligence solution provides users with a comprehensive, data-driven market overview. This enables last-mile delivery companies to understand their performance and how they measure up against competitors. Our data not only visualises your strengths but also serves as credible evidence of your advantages.
Combining this data with comprehensive insights into each webshop in your market provides a significant advantage in sales meetings. You can tailor your pitch using up-to-date information, demonstrating how your solution will enhance the delivery experience for your customers' clients. This personalised approach showcases the specific benefits and improvements your service offers, making a compelling case for why your company is the best choice.

Q4 is a vulnerable time for webshops, where faulty shipments and slow deliveries can be extremely costly. Success often stems from a partnership approach between webshops and last-mile providers.
Engage deeply with your clients to ensure they see you as a trusted partner they can rely on during these critical periods.
In essence, this is where you want your sales and account management team to spend the majority of their time, which can be enabled by strong processes and the right tools/technologies to help your team be even more efficient.
Effective planning and execution require time, structured outreach, and meticulous account management. There is no easy way. The sooner you start, the better positioned you'll be to capitalise on the high season's opportunities. The time is now – not in October.
At Tembi, we bring years of experience in delivering market insights and partnership services that drive success.
Our market intelligence solutions provide last-mile delivery companies with continuously updated data and insights into webshops, delivery provider rankings, export markets, technology usage, product categories, and much more - allowing companies to react swiftly to changes, maintain top rankings, and increase revenue from their existing client base.
We tailor our supportive services to each client's needs, and we would love nothing more than to set up a free, non-committal session to discover how our e-commerce market intelligence solution could help your business achieve its revenue goals—both in Q4 and throughout the year.
ith Tembi you don’t just get enriched B2B company data, we’ve actually visited every webshop on the market to ensure it is operating, analysed its products to understand what product category it belongs to, and connected traffic data from SimilarWeb to understand how its popularity has developed.
A similar exercise would take 82 years for a person if s/he worked without a pause. And we do it bi-weekly.
At Tembi we are fascinated by the challenge of large-scale data gathering and analytics, and the more complicated, the more creative our product and data science team gets.Our Market Intelligence solution for companies targeting webshops - E-commerce Core – visits bi-weekly any active webshop in the European market capturing data on:
• Technology platform (WooCommerce, Shopify, Magento etc.)
• Payment providers/systems (Klarna, Ayden, Stripe etc.)
• Product data (Products sold, number of products, product growth etc.)
• Company data (Ownership, address, warehouse(s), financial data etc.)
• Operating markets (languages, export markets etc.)
On top of this, we use proprietary AI-models to categoriSe each webshop into a product category using both image recognition and large language models (LLM) to ensure high quality data when you filter our database.

We’ve been there ourselves, looking for that last filter to get a precise search result –why we’ve added over 50 filter options to our product to ensure you can find exactly the webshop you’re looking for. Filter or cross-filter on product categories, growth stage, number of employees, website traffic, number of products, languages –and if you would lack a filter, our team is quick to add it (if we have the data of course).
With deep data on each webshop, we can uncover insights by combining data in different ways. Our econometric and AI-models can today predict revenue estimations, company growth and for example technological investments – adding a deeper understanding of the maturity of a webshops operations.
Combining these insights with webshops data further increases your possibility of narrowing your targeting, as well as better understanding your current clients, or where you’ve had success lately.
With better data, we can get better insights that helps us reach our goals faster. If you’re interested in getting a demo or better understand how our clients use Tembi – don’t hesitate to book a call - or find more material about our E-commerce Core Solution here.

n today’s business world, being data-driven is no longer a question; it is a necessity. Organisations that don’t understand how to work with data and leverage it risk falling behind or even going out of business. However, merely being data-driven is not enough anymore. The rapid growth of access to artificial intelligence (AI) and lowered computing cost has amplified the significance of data, driving a shift towards predictive (and even prescriptive) intelligence to stay ahead of the competition.
Transitioning from a data-driven to an AI-driven organisation presents immense opportunities, enabling companies to understand the competitive landscape better, and leverage both market predictions to gain an edge, as well as improving operations to lower operating expenses. This transition requires a fundamental change in how we operate and organise the company. Secondly, we need to decide where to start, and whether to build, or buy a solution.
Here we share five, simple, steps to ensure your organisations success in this transition.
Achieving success with a transition is a strategic choice and an executional leadership challenge. It is crucial for management, whether top-level executives, business unit leaders, or team managers, to clearly communicate that the goal is to capitalise on the benefits of being data-, AI-, or analytics-driven, and where these benefits will have an impact, and why the transition is imperative for the organisation’s success. Leaders should:

Clarifying responsibility is essential as well as identifying the right person to lead the operational work of the transition. Allocate funding centrally rather than locally to prevent initiatives from being perceived as competing with short-term operational needs. By centralizing funding and clarifying responsibility, organisations can ensure that the transition to an AI-driven approach is viewed as a strategic investment rather than an operational cost.
It is unfortunate when initiatives become confined to a single department or individual. The benefits of an AI-driven approach are significant and extend across the entire organisation. Therefore, it is crucial to integrate solutions into as many teams as possible where there is a business case. Engaging more teams in the adoption phase offers several benefits:
Avoid placing the burden on a single individual. Employ the innovative power of the entire organisation to achieve greater success.
For new solutions and strategies to work, they must be integrated into daily operations. Overcoming existing habits and ways of working requires repetition until the new practices become habits. Incorporate the use of data and analytics tools into the organisational rhythm, such as in weekly meetings or daily stand-ups. Measure the impact of these new practices and share the progress with the entire organisation. Highlight how the transition is improving efficiency compared to previous methods.
Fostering an adaptive mindset is crucial for the transition to an AI-driven organisation. This mindset should infiltrate the company culture, regardless of role. Here are three tips for building a stronger adaptive mindset:
It might sound simple, but actively working on lifting and promoting the right people is very often overlooked. Make sure it is part of the leaderships action plan so this practice doesn’t fall between two chairs, or is forgotten within a couple of quarters.
Building a data and AI-driven organisation is essential for maintaining competitiveness in today’s business environment. Transitioning from being merely data-driven to embracing AI and predictive intelligence offers significant advantages, including a better understanding of the competitive landscape, leveraging market predictions, and improving operational efficiencies.
To ensure success in this transition, organisations should follow five key steps. First, management must clearly articulate that becoming an AI-driven organisation is a strategic goal. This involves transparent communication about the importance and challenges of the transition, along with regular follow-ups and continuous leadership support.
Second, organising the transition is crucial. This includes clarifying responsibilities and centralizing funding to ensure that AI initiatives are viewed as strategic investments rather than operational costs.
Third, disseminating the solution broadly across the organisation is vital. Integrating AI solutions into multiple teams enhances collaboration, shares costs, and accelerates the transition, leading to a higher overall ROI.
Fourth, embedding new solutions into daily routines ensures that these practices become ingrained in the organisation’s operations. Regular use and measurement of the impact help highlight the efficiency improvements over previous methods.
Finally, fostering an adaptive mentality is essential. This involves supporting superusers, hiring individuals with an innovative mindset, and promoting a culture that celebrates successes. An adaptive mentality ensures the organisation remains agile and responsive to new opportunities.
By following these steps, organisations can effectively leverage data and AI, achieving sustained success in an increasingly AI-driven world.
iscover data and insight around webshops in Sweden, Denmark, Finland & Norway. This report is free and available on LinkedIn for download.
We've visited and analysed over 70.000 active webshops in Sweden, Denmark, Finland & Norway. Orginsed around three topics you'll find:
➜ Insights around distribution of product categories
➜ Data on delivery prices and delivery methods
➜ Discover which technology platforms power the webshops
And much more ⏩
Go to our linkedIn page and view, or download your copy.
Baltic E-Commerce Market Intelligence Report (Published January 2024)
Nordic e-commerce Market Intelligence Report (Published October 2023)
hen you're pitching as a real estate agent, knowing the details well shows your professionalism and sets you up for success. In commercial real estate, understanding the area around your property can really make a difference. It's not just about showing the space; it's about explaining its future potential and what's happening in the market around it.
While Tembi’s Market Intelligence Platform for Real Estate helps agents find tenants by predicting company relocations, this data is also very useful in pitches to Real Estate Owners.
Here are a few ideas and ways to improve your pitch using data from Tembi’s platform, moving it from a generic presentation to an insightful conversation around the commercial property and its area.
Present deep area insights
Know the types of buildings, available spaces, and current tenants. This lets you understand the area's composition and the types and sizes of businesses likely to move in. Analysing moving patterns helps you see where companies are coming from, how often relocations occur, and how long companies stay.
Predicting Company movements
The commercial real estate market constantly changes, with companies of all sizes reassessing their location needs. Pointing out these potential moves can strengthen your pitch significantly. Clearly explain which businesses might move to the area and why with the help of Tembi’s Moving Probability Score. This shows you understand market trends and aligns with what your clients need.
Space requirements: Tailoring your approach
Knowing how much space a prospective tenant might need is crucial. This isn’t just about numbers; it’s about tailoring your offerings to the market’s needs. Discussing square meters in the context of tenant demands positions you as a knowledgeable partner, not just a facilitator. For example, consider whether it makes more sense to split a 400 square meter office into two or three units based on moving patterns and the area’s composition.
Catering to the right tenants
The types of companies moving into an area can greatly influence a property’s value. Whether it’s tech startups or law firms, understanding this dynamic can transform your pitch. Match the property’s features with the expectations and culture of incoming companies.
Data-driven discussions
Back up your claims with data, market analysis, or company data. Having this data at your fingertips boosts your credibility. It shows you’re informed, and your insights are based on reliable sources. By using targeted, data-backed information, you reduce time spent on generic preparations. This lets you create a more impactful presentation that addresses specific client concerns and market opportunities.
Lifting the conversation
Move from generic pitches to discussions that resonate more deeply. Talk about the property and its area not just as they are, but as they could be. This encourages deeper engagement from potential clients who see you understand their long-term success.
Knowing how the area around “your potential” property is developing gives you a strategic edge. It allows you to anticipate changes and position your property as a smart choice in an evolving landscape.
In commercial real estate, winning a pitch often comes down to how well you understand and convey a property’s location potential. By focusing on the broader context, you turn a simple sales pitch into a compelling vision of the future, clearly showing why the smart choice is to act now, with you.
Interested in knowing more about Tembi’s Real Estate solution, don’t hesitate to book a meeting with Dennis.
Read more about our Platform.
n the ever-evolving landscape of e-commerce, the race to secure customers and meet their delivery expectations has never been more intense. Last-mile delivery providers are constantly seeking new e-commerce clients, but what if I told you that there's a critical factor many overlook? It's not just about acquiring new clients; it's about optimising your position in their checkout process. Here's why:
At Tembi, we understand the significance of where a delivery provider stands in the checkout process. Did you know that up to 60% of final package orders go to the top-ranking delivery provider? This means that by being ranked number 1 instead of 2, 3, or 4 at your clients, you could double or even triple the number of orders from a client.
Interestingly, but not surprisingly, our data shows that the top-ranking delivery provider is the cheapest option in up to 80% of cases.
End-user delivery fees depend on the independent deal between last-mile providers and webshops. Other than lowering the delivery price paid by the e-commerce company, there are several ways to affect this.
Progressive discounts based on order volume, collaborative logistic offerings, reliance on service, and related solutions are all options that can help e-commerce companies offer your last-mile delivery service as the cheaper option for the end user.
However, it's about more than just being the cheapest option. Factors such as delivery time, delivery method, sustainability options, and collaboration with the delivery company also play significant roles. One or more of these are always present when the cheapest option differs from the top-ranked delivery option.
Consumers are increasingly conscious of environmental impact and delivery speed, making these factors crucial in their decision-making process. Therefore, they are also weighed in terms of the webshop owner's priorities and systems.
Losing your top ranking can be disastrous, but it's often discovered too late. Sometimes, you only realise this at the end of a quarter when financial results reflect the drop in orders. It's crucial to act swiftly on changes at your clients.
The Tembi Market Intelligence Solution for e-commerce gives you updated insights into your market's webshops, including delivery providers, checkout rankings, export markets, technology use, product categories, and much more.
This not only enables you to identify new ideal client profiles but also to quickly react to changes in your existing clients – like when you lose or win a top 1 position.
Many of our clients establish a business case for using our market intelligence solution for e-commerce based on new client acquisition alone. However, the value of working strategically and tactically to monitor and react to changes in checkout positions at existing clients often significantly exceeds the value of client acquisitions alone.
From several of our Last-mile delivery clients, we have witnessed an average of 30% - 50% increase in top-1 rankings working tactically with this. Typically, this amounts to a total increase of 20%- 33% in revenue from the existing client base!

Curious to learn more? Eager to get started?
Contact Tembi for a commitment-free discussion about our solutions and services to help you optimise your revenue from your current and future e-commerce clients. With Tembi's market intelligence, you can stay ahead of the competition and secure your position at the top of the checkout page.
In the fast-paced world of e-commerce, every advantage counts. By focusing on client acquisition and optimising your checkout positioning, you can ensure your last-mile delivery business thrives in today's competitive market.
Click here to schedule a call today.
ccess website traffic data inside Tembi.
We are happy to share that we’ve entered into a data partnership with Similarweb where we display monthly website data traffic inside our Market IntelligencePlatform.
Using Tembi, you can now use the data from Similarweb to filter your search based on traffic volumes, see historical data on selected webshops and be able find the growing webshops within different product categories.
For access or inquires, please contact our e-commerce responsible Peter.
ead list generators is a red ocean. Thousands of companies offer multiple ways to filter company or technology data to narrow down a segment of potential clients.

The challenge: Precision is quite poor as data is not contextualised.
Customer problem: Lead list is very inaccurate, leading to many disqualified leads and lost of time. (And irritation.)
Our machines have been learned and optimised over the course of years to automatically categorise webshops based on product category. We started with 16 categories two years ago, and today we have 38 product categories (i.e. Shoes, Fashion, Beauty, Car parts, Beverages, etc.).
This is how we do it, and this is why our clients see a reduction of disqualified leads with over 80% after switching to Tembi. (If time is money, then an 80% reduction is quite a lot of money.)
Web Scraping
We’ve built custom web scraping tools that automate the collection of data from each webshop. We run hundreds of different scrapers to ensure we can gather the right data.
Data Cleaning
We process the scraped data to remove irrelevant information, correct errors, and prepare it for analysis.
Natural Language Processing (NLP)
We use NLP techniques to analyse the text data from webshops and product descriptions and names. Which helps us understand the context and categorising products based on their characteristics.
Machine Learning (ML) Classification
We've trained a machine learning model on a dataset where the product types are already known. This model is used to classify the products in webshops into predefined categories.
Manual Review and Feedback Loop
We constantly review the process to ensure accuracy and continually improve the ML model through a feedback loop.
And this is why when you look for a website that sells clothes on Tembi, you will only find webshops that sell clothes.
To date we have validated over 1 million webshops around Europe, and update our data several times per month to ensure a very high quality that help sales and marketing teams find the webshops that match their ICP.
Interested in knowing more about our e-commerce solution and how we categorise webshops? Download the product presentation or book a meeting for a demo.
ind the webshops you’ve always been looking for - Small or large, local or international, on the rise or in need of a strategic nudge.
At Tembi we look beyond general company and webshop data, and visit each webshop to better understand which type products are being sold, the technological platforms in use, and for example, what software's are powering the webshops communications, performance and operations.
Our machines do the equivalent job of thousands and thousands of people daily researching the web, collecting information, gathering data and putting it together in one place. Webshop after webshop.
“Securing the right targets at the right moment isn’t just about closing deals—it’s about gaining a strategic advantage. With Tembi’s latest market intelligence innovation for Software Providers and Digital Agencies, whether your focus is business development, sales, or marketing, you’ll gain an excellent perspective on market dynamics.”
Michael Bugaj, CMO at Tembi
We're not just about scratching the surface. Our goal is to deeply understand each webshop, connecting them to their parent companies to unveil their financials, interconnected webshops, and operational domains.
By integrating information from multiple places into a singular, comprehensive view, we enable sales and business development teams to better segment the market, and see where new opportunities are developing, and link that to individual companies, refining lead list and decreasing disqualified leads with up to 80%.

When we initially ask potential clients how many webshops they believe there is in their market the typical answer is around 1/3 of the market, meaning most of the market goes unnoticed.
Who are the emerging stars? The niche players about to grow? With Tembi, these questions find their answers. Our platform allows you to input your ideal customer profile, creating alerts for when potential leads meet your criteria.
Besides significantly simplifying the process of gathering data, here are five immediate benefits:
1. Extensive filtering options to match your ICP
Filter on location, products, markets, financials, ownership, and +50 other possibilities to find exactly the cohort that matches your ICP and/or campaign.
2. Rapidly grow your pipeline
With your ICP in place, see immediately the whole lead list on your market, and set up notification for automated new matches.
3. More information on your ideal targets
Understand you targets business and its situation better. Get clarity around their product offering and development and how you can help.
4. Spend your time right
Up to 80% less disqualified leads frees more time to be able to focus on closing the deals.
5. Understand your market
We monitor the market weekly and visualise trends and movements so that you can better understand how the market develops and identify new opportunities.
Interested in knowing more about our e-commerce solution? Download the product presentation or book a meeting for a demo.
Tembi is a data and analytics company, providing a software solution designed to deliver market information and insights that give our customers a better understanding of their market and how it develops. Our Market Intelligence Platform gathers and connects data from multiple industries to give a more precise and correct overview the market and its companies.
ast month we published our commercial relocation predictions for 2024 in Denmark, and today, we're publishing our Market Intelligence report for Swedish Commercial Real Estate.
Our data science and econometrics team looked through Swedish data from the last six months together with our predictions models to see which companies in Sweden scored a high moving probability. Looking at companies with minimum five employees, we predict that 4698 companies and production units will change address next year.
Inside the report you'll find, besides relocation predictions, relocation data from the last six months, which industries saw the most movement as well as moving velocity - how many companies have relocated in the three biggest areas in Sweden during the last three years.
After reading the report, If you're interested in getting a sample of which companies will relocate next year in Sweden, book a demo, and we will prepare data for you.

s the Swedish real estate market continues to evolve, new trends are emerging, particularly within the commercial sector. Our latest Market Intelligence Report offers an in-depth look into these shifts, providing deep insights and predictions for 2024that could help the industry better understand the market. And where to look for opportunities.
The past six months we have seen a significant activity within the Swedish commercial real estate scene. Over 3,005 companies, each with more than five employees, have relocated, showcasing a trend that follows previous years patterns. Notably, businesses ranging from 5 to 9 employees formed the majority of these moves, highlighting a high activity within this segment.
The Predictive pulse of 2024
Looking ahead, our analytical models have identified a high relocation indicator for 4,698 companies having more than five employees. This indication, drawn from AI models and extensive market data, suggests an active year with a lot of potential. Interestingly, the bulk of this movement is expected from companies with 10 to 49 employees, pointing to a important reshuffling in the commercial real estate space.
Regional Revelations
The report sheds light on the geographical nuances of these relocations. While the Stockholm region has traditionally been a hub of activity, the forthcoming year places a spotlight on Gothenburg, anticipating a higher volume of larger entities on the move. This regional redistribution of commercial real estate activity underscores the diverse opportunities unfolding across Sweden.
In light of that, we also see that companies and production units with more than 20employees in Stockholm tend to move more often than in other parts of the country. 33% of companies in Stockholm changed address during the last three years, while the same number in Gothenburg is 27%.
The Industries on the Move
Diving deeper, certain industries emerge as more mobile than others, including sectors like insurance, information services, and staffing solutions.
Why This Matters
For businesses and investors, understanding these patterns is crucial. The shifting sands of the commercial real estate market offer both challenges and opportunities. For investors, it's a chance to anticipate demand in growing areas and sectors. For businesses, the insights provide a roadmap for strategic decisions about where to plant their flags in a competitive landscape.
Access the full report by clicking on the picture below
he e-commerce sector in the Baltic region has seen consistent growth throughout the last ten years, opening up a number of opportunities for investment. Estonia and Latvia, in particular, stand out as some of the most rapidly expanding online retail markets within the Central and Eastern Europe (CEE) area.
Our first Market Intelligence report for the e-commerce Market in the Baltics looks into the foundation of the Industry and its suppliers
Find data & insights around:
🛍️ Number of Webshops in Estonia, Latvia and Lithuania.
📊 Webshop product category distribution per country
⚖️ Market specialisation
📦 Delivery providers, prices and methods
🖥️ Technology platforms that power the webshops
...and much more.
Access the full report for free by clicking on the image below!

f you're a marketer or sales representative in any B2B market, you know the challenges of identifying your Ideal Customer Profile (ICP) among your total market. It's not always a straightforward process and getting it wrong can be costly.
Failing to identify the ICP means wasting time and money on unsuccessful outreach, attending irrelevant meetings, and seeing your closing rate decline.
On the other hand, getting it right can lead to successful outreach, higher client relevancy, an increased win rate, and acquiring more clients with fewer resources. There is a lot to gain.
At Tembi, we've spent countless hours helping our clients identify and target their ICP. To help you start your journey, we've created a 5-step guide on how to get your ICP work right.
One of the interesting aspects of identifying your Ideal Customer Profile (ICP) is that you can often find the answer right in front of you - among your existing clients. Try to identify patterns among your most successful and satisfied customers. Look for similarities in industry, company size, location, and purchasing behaviour.
Finding common characteristics among your top customers will help you gain insights into the type of companies that are best suited to your solutions.
Create detailed buyer personas that represent your ideal customers within different segments of your target market. Consider job roles, responsibilities, goals, challenges, and decision-making criteria.
Use both quantitative data and qualitative insights to flesh out these personas. Give each persona a name and backstory to make them relatable and memorable for your sales and marketing teams.
To gain a better understanding of the market in which your B2B solutions operate, it's important to dive into market insights. By staying up-to-date with emerging trends, challenges, and opportunities within your target industries, you can effectively identify common pain points or needs that your solutions can address.
To achieve this, intelligence solutions like Tembi can be helpful. By using the right insight tool, you can identify patterns across your market and discover what is currently driving change for your potential clients.
Identifying and targeting your Ideal Customer Profile (ICP) can be a challenging task, even with your ICP and buying persona in hand. There are several useful tools available that can help you identify industry players, but when it comes to narrowing down your segments, you only have three options:
1. Devote lots of manpower and resources from your team to conduct research in your segment.
OR
2. Seek paid consultancy to support the research needed.
Or
3. Use a market intelligence solution that delivers the necessary insights into your market
At Tembi, we specialise in the latter option. We provide deep insights into entire markets, with the ability to cross-filter and monitor your potential and existing client base.
Building an ideal customer profile is an iterative process that requires ongoing refinement.
Finally, make sure you have the intelligence solution that allows you to identify new targets quickly when tweaking your ICP.
Tembi is here to help. Our team of experts has spent thousands of hours supporting clients from various industries, providing deep market insight solutions that are tailored to their specific needs.
Our Tembi Market Intelligence solution can help you quickly identify and target new clients, giving you an edge in winning their hearts.
Whether you're looking to learn more about Ideal Customer Profiles (ICPs) or want some qualified input into your targeting process, our team of targeting specialists is ready to assist you.
You can book a free and non-committal assessment with one of our specialists today by clicking the link below.
About the Author
Thomas, our CCO, has over 15 years of experience working with client targeting and acquisition across various industries. Trust us to help you take your business to the next level!
ogether with Andre Veskimeister and Parcel Locker Central we've published the Tembi Delivery Index - a monthly index that tracks the average price that e-commerce businesses charge private customers for delivery.
The index is a useful tool for logistics companies, e-commerce retailers, and consumers to understand the delivery landscape's pricing dynamics over the three most common delivery methods: Home delivery, Parcel locker and PUDO (Pick Up Drop Off).

The Tembi Delivery Index covers today Denmark, Norway, Sweden, Finland, Estonia, Latvia, and Lithuania. More markets will added during 2024.
All the data is drawn from Tembi’s Market Intelligence Platform from a sample of over 100.000 webshops by picking a random product outside the free delivery range and analysing the average delivery prices & delivery methods.
urious about the Danish Real Estate market and how it moved? Our new Market Intelligence Report provides a comprehensive analysis of the Danish commercial real estate market. Key highlights include:
This report is a valuable resource for anyone interested in the dynamics of the Danish commercial real estate market, providing data-driven insights and predictions to inform strategic decisions.
Access a free version of the report here.
ata analytics has become the cornerstone of strategic business decision-making. But what is the difference between diagnostic and predictive analytics? This visual and simple guide represents the evolutionary journey of analytics, from basic understanding to advanced prediction and optimisation.

This is our starting point, where we use historical data to understand past performance.
Here, we dig deeper, using the data to uncover the root causes of past events.
Leveraging statistical models and machine learning, we forecast future trends and behaviors.
This is the pinnacle of analytics maturity, where we not only predict the future but also provide actionable recommendations to shape desired outcomes.
As we move up the ladder from hindsight through insight and towards foresight, the difficulty increases, as well as the data requirement - but it significantly amplifies the value and optimisation capacity of our decision-making processes.
s a real estate professional, you know that timing and information are everything. Identifying which businesses are planning to relocate mean the difference between closing a deal and missing out.
But what if you could predict these moves before they happen?
At Tembi we have developed a solution that gives real estate professional market foresight, and a real competitive edge establishing early client relationships. Our advanced artificial intelligence platform provides you with the ability to anticipate company relocations, transforming the way you secure leads and grow your business.
Traditionally, figuring out which companies are planning to move offices has been a matter of luck or extensive networking and marketing campaigns based on limited data. By the time, a company is ready to look for a new location, or inverse a property hits the market, it is already a race against dozens of other real estate professionals who are also in the know.
At Tembi, we have leveraged artificial intelligence to change the game. Our Real Estate Market Intelligence solution is not just another database – it is a predictive tool that can forecast whether a company will move in the next 6 to 12 months, often before the company itself has identified the need to relocate.

Our proprietary machine learning models analyse vast amounts of data points, from building data and economic trends to company growth patterns, to provide a prediction score on companies likely to move. This insight gives you a significant head start to prepare a proposal, reach out, build a relationship, and maybe even secure a deal before others even know there is an opportunity.
And if you own properties, our Moving Prediction Score is a great tool to health check your current tenants and where they “stand.”
Over time, our machine learning models have become very precise. When we estimate that a company will grow, we are right nine out of ten times , giving it a 90% precision rate. And most companies that will move, we capture.
But we do not just stop at predictions. Tembi provides you with access to comprehensive company data, including size, financial health, and industry segmentation. This information allows you to tailor your approach to each potential client's unique needs and preferences.

With Tembi’s solution, you are not just getting leads; you are getting a consultant's perspective. Understanding the dynamics of the real estate market is crucial, and we give you the knowledge and insights to navigate it effectively. This means you can position yourself strategically in the market and close deals faster, giving you that competitive edge.
Currently, Tembi's Real Estate Market Intelligence is available to real estate professionals operating in Denmark and Sweden, with plans to expand to other markets soon.
Are you interested in getting more information. Please fill out the form below and we will get back to you as soon as possible.
f you knew which company would move within the next six, or twelve months, what would you do with that prediction?
During the last month I have talked with many Real Estate professionals within different sectors in the real estate industry, asking them the question how an understanding of companies moving intentions would change their work and approach. As expected, they all had different answers and saw different possibilities.
Below I have paraphrased three answers that stood out during my conversations.
“As a Real Estate Agent, I would analyze our commercial rental pipeline to identify nearby businesses in the right segment with a high probability of moving. Then reach out to them. But I would also use that knowledge when I try to close potential new clients.”
“Check our tenant status and see if anyone is about to move. The dialogue with our tenants is the most important thing, and this insight will allow me to reach out to them proactively, talk about their journey, and understand if their needs will change soon. So, we can make sure that they will be relocated and stay as tenants with us.”
“Of course, twelve months is a short time frame for us. However, previously, 12 months is far too short for us, but we are experiencing more frequently than before that large companies are not as inclined to commit to leases 24-36 months in advance. In addition to being very interested in understanding how an area is developing and where there will be a need for future offices, we would also use that knowledge to ensure we find tenants for our upcoming projects.”
Predicting if a company will move or not is not science fiction anymore. By continuously collecting and gathering millions of data points, we have at Tembi developed a Moving Prediction Score (MPS) that can predict with over 90% precision if a company will move within the next twelve months. That is about 20 times as good as a random guess.
Using artificial intelligence (AI) and gathering unique data, we can predict how a company will grow, how the number of employees will change and when they would need to move to new offices, as well as understand where they might want to move. Calculating the MPS, we do not only look at historical data, we combine different machine learning models and use this across industries and geographies. Our models are trained on 80 % of the company locations, and we test the models the remaining 20 % to see if we are right or wrong. And that is how we can reach a validated precision of 90%.
If you are interested in hearing more about how our Moving Prediction Score works, or how it can be applied to your business, do not hesitate to reach out to us.
ith our E-commerceMarket Intelligence Report, we have taken a deep dive into the e-commerce industry in Sweden, Finland, Denmark, and Norway to better understand delivery price differences, who are the dominant delivery providers and i.e. which technology providers power all the webshops.
The report is packed with data & insights to give the reader a better understanding of the market as well as the competitive landscape.
The nordic e-commerce is growing fast, with a market size of over €38 billion distributed over 76.000 webshops. Out of the regions 27 million people, more than 19.5million are online shoppers. It's also an exciting place for startups — over the past three months, 4,848 new webshops have opened up online.
All data in this report comes from Tembi’s E-commerce Intelligence Platform (EIP).
We don’t talk about consumer data in this report. We only focus on the businesses in thee-commerce industry, such as webshops, delivery providers, and technology providers.
Type in your details below, and get a version asap in your inbox.
n the fast-paced last-mile delivery sector, market intelligence is essential for success. By understanding your customers, competitors, and market trends, you can make informed decisions that lead to growth and profitability.
Market intelligence can help you identify new market opportunities, improve operational efficiency, and develop new products and services. It can also help you stay ahead of the competition and differentiate yourself from the crowd.
In this blog post, we have outlined a few specific examples of how last-mile delivery companies are using market intelligence to grow their businesses.
Staying ahead of the competition
Market intelligence can help last-mile delivery companies understand the competitive landscape and identify new ways to differentiate themselves. For example, a company might use market intelligence to identify new technologies that can help them improve their delivery services, or to develop new pricing strategies that are more competitive.
Identifying new market opportunities
By tracking market trends and customer behaviour, last-mile delivery companies can identify new markets to expand into or how green delivery is developing. For example, a company might identify a growing demand for same-day delivery in a particular city or region, or an understanding of the competitor's solution and market penetration of different delivery solutions.
Understanding website traffic patterns and consumer purchase behaviour
Last-mile delivery companies can today track which product categories are growing and which webshop’s are growing in popularity, as well as which international sites are exporting to one’s country. By doing so, last-mile delivery companies can establish early partnerships abroad and better equip themselves for future demands and growth.
Developing new products and services
Market intelligence can help last-mile delivery companies understand the needs of their customers and develop new products and services that meet those needs. For example, a company might develop a new service that delivers packages to customers' workplaces, or a possibility to get delivery at very specific times in the evening.
Improving operational efficiency
Market intelligence can help last-mile delivery companies optimise their delivery routes, reduce costs, and improve delivery times. For example, a company might use market intelligence to identify the best locations for new warehouses, or to develop more efficient delivery schedules.
Getting good data for Market Intelligence is not easy, as it requires a lot of time, and quite often a big investment in data infrastructure and a plan to keep high quality and ensure data is actualized. Hence, many decisions are taken without bringing external factors into the mix or using poor data as a ground.
Different Market Intelligence platforms collect different types of data and can help companies better understand the market dynamics. Here are a few tips and suppliers for getting started with market intelligence.
As with any strategic decision, starting the process, you need to define your goals. Market intelligence is not an answer, it is a tool. Are you looking for growth within a particular type of webshops, or price development of different delivery methods? Or a more complex question around identify new market opportunities. Once you know your goals, you can start to identify the data and insights you need.
Collect data
There are many different sources of market intelligence data, including customer surveys, industry reports, and government statistics. You can also collect data from your own internal systems, such as sales data and customer feedback.
Analyse the data
Once you have collected data, you need to analyse it to identify trends and insights. You can use a variety of tools and techniques to analyze data, such as data analytics software or more advanced methods using machine learning.
Share the insights
Once you have gained insights from your market intelligence data, you should to share them with your team to gather input, feedback, and get new ideas so you can keep iterating your work. You can either do a presentation or set up a dashboard that monitors the data and actualises your insights.
Our E-commerce Intelligence Platform – EIP – monitors every webshop on the market, and provides data around providers, prices, and delivery methods. This data can be filtered from a webshop category perspective or for example revenue, providing a comprehensive overview and intelligence of the market and competitors. Hence, EIP both collects and analyses the data, and provides (shares) the insights in simple overview. In other words, decision-ready intelligence.
ith the E-commerce Intelligence Platform (EIP), we have set out on one of our most ambitious data and analytics ventures yet: to authenticate and catalog every webshop globally, defining product categories, individual products, and the delivery infrastructure. Our aim is to build the most expansive and current e-commerce database, one that can proactively empower webshops, carriers & delivery providers, and suppliers to navigate through the dynamic, ever-expanding market.
EIP was first introduced in Denmark in 2021 and has since extended its reach to Sweden, Norway, Finland, the Netherlands, Latvia, Lithuania, and Estonia. To date, we systematically and repeatedly index, validate and analyze over 200,000 webshops, classifying them into different product categories.
So, why embark on this colossal task?
The objective behind EIP is to provide the industry with unparalleled Market Intelligence. To achieve this, it was imperative for us to go beyond the surface-level offerings and gain a deep understanding of the last-mile delivery mechanics, the various providers involved, and the pricing structures.
All webshops in one place
EIP offers a comprehensive market overview, identifying and validating every operational webshop, while discarding inactive ones. We have established a direct link between each webshop and its owner, detailing ownership, headquarters, and financial figures. By evaluating the webshops' offerings and categorizing their products, we understand the technological platforms utilized and the delivery services provided, including pricing and export capabilities.
Our "Market Scrape" equips users with a detailed snapshot of all webshops in a specific market. For deeper insights, particularly into the largest, custom-built webshops, our "Custom Scrape" service offers an in-depth analysis.
Checkout monitoring
Understanding the last-mile market, we monitor each delivery checkout on all webshops, gathering information about providers and their position on the list of delivery options, delivery methods and prices, free-delivery threshold, and green delivery options – giving us comprehensive view of the shipping market and how it evolves from a public perspective.
We keep a pulse on the last-mile delivery market by continuously monitoring checkout processes across webshops. This monitoring captures data on delivery providers, their ranking in delivery options, pricing strategies, thresholds for free delivery, and eco-friendly shipping options, thereby offering an overview of the evolving shipping landscape.
Decision-ready Market Intelligence
Merging our data with metrics like order volumes allows last-mile delivery providers to proactively respond to changes in their checkout positioning, preventing potential revenue drops.
“Prior to Tembi, identifying a lost position at a store’s checkout could take up to six weeks, during which we would lose about 64% of order volumes. With EIP's immediate updates, we can swiftly address the issue, preventing significant revenue losses”
Webshop integration manager
Let us say you charge €3,0 per delivered package and expect 100 packages per day (on average). The daily revenue is €300. Losing 64% of the volume equals to a loss of €192 per day. During six weeks that loss amounts to €8.064.
With EIP, as soon as a positioned is lost, you are notified, and can talk to the store, and manage your delivery operations immediately.
From a strategic perspective, both as a webshop owner, as well as delivery provider, you can track which delivery methods are popular, what are the market prices, and where is the market developing, both on your own market, but also abroad.
Automated lead generation
Understanding the supplier network of providers for webshops within different fields - delivery, payments, and technology - opens an overview of who works with whom. Giving providers competitive intelligence and a perfect data set for lead generation and prospecting.
As a delivery provider, being able to see all your clients in one simple overview with metadata, you will equally see where you are not present. By understanding previous relationships and solutions used, you can improve your sales pitch and competitive edge.
There are multiple ways to use EIP and the data. Here are a couple of examples.
EIP for Account Managers
See what technologies your clients are using, and which providers they work with. If you work with last-mile delivery, you can see your position in each check-out and follow your client's business and get the latest data before your check-up.
EIP for prospecting
Whether you work with professional services for webshops or selling software, you can find each webshop on your market and find precisely the type of webshop you are looking for with our filters.
EIP for Business Development
See and follow market trends, track your competitors and always be up to date.
EIP for Customer Success
From the moment you have a new client, follow the implementation and results. Track critical changes and get access to detailed customer business information.
EIP for Analysts and Business Intelligence
Via our API you can extract all our data to your own system and combine external data with your internal data to track correlations, get a full competitor, and market overview.
“A dynamic market requires ongoing data collection.”
Christian Mejlvang, head of product at Tembi
Our data foundation is robust, encompassing over five billion data points, which include both real-time and historical data collected from 2021. We augment this repository daily with over one million data points to guarantee not only the high quality of our data but its relevance as well.
Utilizing diverse machine learning techniques such as AI (Artificial Intelligence), NLP (Natural Language Processing), LLM, and image recognition, we convert raw data into actionable intelligence, aligning with our commitment to transforming data into insight. This data undergoes a process of enrichment, contextualization, and multi-level automated verification to ensure its integrity. We categorize our data into three tiers of quality—Bronze, Silver, and Gold—and it is only the Gold-standard data that is displayed on the EIP platform, reflecting our dedication to the highest standards of excellence.
Our data acquisition strategy is multifaceted: 1) sourcing open data, 2) procuring datasets from various providers, 3) deploying our proprietary scrapers to gather exclusive data, and 4) generating novel data through analytical methods applied to the data we have. This fourth approach underpins our Predictive Market Intelligence service.
We employ a combination of econometric and predictive machine learning models to create proprietary datasets. These are instrumental in our analysis of market trends and trajectories, providing an innovative perspective on market dynamics.
Interested in knowing more about EIP? Contact us.
here are many “intelligences” in the world of business. Besides the cognitive ability of a business’s staff, it refers to the information that has been gathered, analysed, and presented in a way that is useful for decision-making. It is not just raw data; intelligence is actionable information that provides insight into a particular subject, such as a competitor’s activities or internal business capabilities. "Intelligence" is a multifaceted term that usually denotes a high level of understanding, awareness, or information processing, whether by humans, collectives (like organizations), or technology.
What type of intelligence is needed often depends on what strategic decision you are looking to make, what type of resources you have, and the amount of data. Here are the ten most common ones:
Business Intelligence is a technology-driven process for analysing data, presenting actionable information to help executives, managers, and other corporate end users make informed business decisions. BI encompasses a variety of tools, applications, and methodologies that enable organizations to collect data from internal systems and external sources, prepare it for analysis, develop and run queries against the data, and create reports, dashboards, and data visualizations. This process offers comprehensive business metrics, often in real-time, to support better decision-making. With BI, businesses can focus on data-driven strategies to address weaknesses and capitalize on strengths.
Market Intelligence is the gathering of relevant data about the entirety of a company's market space. It covers broad spectrums such as understanding industry trends, identifying market opportunities, and detailed insights into competitors and customers. This intelligence is crucial for forming market entry strategies, pricing models, business development and sales & marketing initiatives. It aids businesses in anticipating market shifts and consumer needs, enabling proactive rather than reactive strategies. The insight gained from market intelligence informs various strategic decisions, such as market opportunity assessment, market penetration strategy, and market development.
Marketing Intelligence is the practice of collecting data from a variety of sources about the market environment a business operates in. It includes the analysis of consumer behaviour patterns, campaign outreach, and purchase triggers. The focus is to understand the success of marketing efforts and to gauge the sentiment and preferences of current and potential customers. It influences tactical marketing decisions and helps businesses adapt their strategies to better meet consumer expectations, enhance brand loyalty, and optimize return on marketing investment.
Competitive Intelligence refers to the systematic collection and analysis of information about competitors and the competitive environment. CI aims to provide a complete picture of the marketplace and the forces at work within it, encompassing aspects such as competitors' strategies, market developments, new entrants, and technological advancements. Effective CI provides a legal and ethical means to anticipate competitive moves and stay ahead of industry trends, supporting strategic planning and risk management.
Customer Intelligence (CI) is a sophisticated analysis of customer data designed to create comprehensive portraits of ideal customers to better understand and predict their behaviour. It is an advanced step beyond basic customer service, seeking not just to address customer needs but to anticipate them. CI combines demographic and psychographic data with transactional and behavioural insights to paint a detailed picture of current and potential customers. This intelligence helps in personalizing marketing strategies, enhancing customer experiences, and boosting customer loyalty. In the age of big data, companies leverage machine learning and AI (Artificial Intelligence) algorithms to process vast amounts of information, providing a deep dive into customer preferences, pain points, and potential opportunities for cross-selling and up-selling.
Financial Intelligence combines understanding a company's financial health with the savvy to use this data in making robust decisions. It involves the analysis of financial data like cash flow statements, balance sheets, and income statements to grasp a company's financial condition and forecast its future performance. It is not just about number crunching; it also includes reading between the lines of financial statements to identify the underlying performance factors, assessing the company's fiscal policies, and ensuring regulatory compliance. Financial Intelligence helps in capital budgeting, financial planning, and aligning financial goals with corporate strategy.
Operational Intelligence (OI) is the real-time dynamic, business analytics that delivers visibility and insight into data, streaming events, and business operations. OI solutions run query analysis on live feeds and event data to deliver real-time operational insights. It involves understanding and optimizing labour productivity, machinery performance, and other operational sectors. By integrating and analysing data from various operations, businesses can quickly identify and address inefficiencies, ensuring the smooth functioning of processes and supporting continuous improvement.
Sales Intelligence refers to technologies, applications, and practices for the collection, integration, analysis, and presentation of information to help salespeople keep up to date with clients, prospect data, and drive business. It includes a range of activities, such as tracking customer data and interactions, social media monitoring, and sales forecasts. With accurate and insightful sales intelligence, sales teams can enhance their productivity, improve lead generation and conversion rates, and drive increased sales and profitability.
Product Intelligence involves collecting and analysing data concerning one's products and those of competitors. It is pivotal in understanding how a product performs across its lifecycle, which features resonate with customers, and what improvements should be prioritized. This intelligence is crucial for product development, management, and innovation, informing companies about user feedback, product usage patterns, and market demands. By leveraging product intelligence, businesses can tailor their product offerings to better meet customer needs and stay competitive in the market.
Technological Intelligence is the systematic gathering and analysis of information about the technological environment of a business to aid decision-making. It includes tracking trends in technology advancements, research and development within the industry, patent filings, and regulatory changes. With a solid technological intelligence strategy, a company can foresee technological disruptions, identify new business opportunities, innovate, and maintain a competitive edge. This intelligence is vital for strategic planning, particularly in industries where technology evolves rapidly and is a key differentiator.
Many types of intelligences are not exhaustive and often overlap. Businesses typically leverage a combination of these intelligence types to inform various functional and strategic areas within their organizations.
aking a decision is easy but knowing how to make the right decision at the moment of choice, now that is tricky. As the outcomes and consequences are only known after the decision has been made, we try hard to mitigate the risk of making a wrong one.
Like a game of probability, we weigh different information and data, and play out the possible outcomes against each other to narrow down our choices, and, well, make a bet. Given the vast amount of information and data available, gathering the needed and relevant information can be a challenge. For the human mind it is impossible to grasp all inputs and data at once. And it is practically impossible. Additionally, as we learn new information, we may create new connections and gain new insights that open new possibilities. Which often leads to the question, "What if...?"
Lastly, before executing the decision, we weigh our options and evidence, and filter it through the personal and/or corporate value filter. By repeating this process, and adding a decision-review step, we learn how to make better decisions. The more we know, the more experience we have, the better our chances of making the best possible choice. And that is how it has been for the last ten of thousands of years.
While we have evolved our ability to gather and access information with software, and made the analytical part simpler and more accessible, machine-assisted decision making and execution is about to change the decision-making process.
The human brain can process 11 million bits of information per second, but our conscious minds can handle only 40 to 50 bits per second. And while we do not always forget, retrieving the right information at the right time is not straightforward.
Our ability to gather and analyse data is limited by our knowledge, time, and “computational power.” However, if we know what information we need, there are now thousands of tools that can help us gather the data and connect it with other data sources to uncover new insights and patterns.
Predicting the future based on historical patterns is not a complicated science, but rarely a trustworthy one. Machine learning algorithms have increased the accuracy and given us a better foresight of how decisions and events might unfold, making it possible to simulate different scenarios and study decision consequences without having to execute a decision. The possibility of setting up “What-if” scenarios and playing them against each other, pushes us closer of being able to make the right, rational decision.
Building on the previous point about the importance of good data, let us talk about the challenge of data diversity. Machine learning models are only as good as the data they are trained on. If you train a model on a narrow dataset, it will only be able to make predictions that are relevant to that dataset. For example, an automated script writer that is only trained on movies and books written by Quentin Tarantino will always produce scripts that are similar to Tarantino's work. The same thing happens if you run your analytics only based on your company's internal data without considering external data such as market and competitor data.
Powerful and accurate models combine data from a variety of sources to reduce bias, improve generalisation, and identify new patterns and insights. For example, a company that is developing a model to predict customer churn could combine data from its internal CRM system with data from external sources such as social media and customer reviews. This would help the company to identify patterns and insights that it would not be able to see by looking at its internal data alone.
The one type of analytics that will profoundly change our decision-making process, and profoundly change how we work, is prescriptive analytics.
Prescriptive analytics is (currently) the final stage in the analytics spectrum, which includes descriptive, diagnostic, predictive, and prescriptive analytics. Descriptive analytics answers the question "What happened?", diagnostic analytics explain “Why it happened!”, predictive analytics addresses "What might happen?", and prescriptive analytics tackles "What should we do about it?", including all former analytics in its process.
When we make decisions, all these analyses happen naturally in our brain and are part of our decision process. The extent of how much we analyse depends on the time we have, the number of people involved, and the consequences of the decision. If we have little time or the stakes are low, we may make a quick decision with minimal analysis. However, if we have more time or the stakes are high, we will spend more time trying to analyse the situation and considering our (imagined) options.
If we turn to machine-assisted decision making powered by prescriptive analytics many of parts of decision process become automated. Using machine learning, algorithms, and computational modelling, prescriptive analytics provide insights, simulates different scenarios, and suggest actionable steps in response to a predicted outcome or scenario.
For example, in supply chain management, prescriptive analytics might suggest optimal routes for delivery based on predicted weather conditions, anticipated traffic patterns, and historical accident data. Or, in finance, it could recommend investment strategies based on a forecasted economic downturn.
A step-by-step decision-making process includes most commonly these seven parts:
Imagine that you have a data foundation that gathers all your data in one place, both external open data (market, competitors etc.) and internal. You have billions of rows of present and historical data, cleaned, enriched, and contextualised. You are a Business Development Manager at a Last-Mile delivery company, and you are tasked with expanding sales to a new area. Where do you start?
1. Identify the decision
In which geographical area can we increase our revenue the most?
2. Gather information
Where are our competitors present?
What are our competitors' prices?
Where are our terminals?
How much are we today delivering in each area?
What delivery options are the most popular in which area?
What investment will be needed for each area?
Etc.
3. Identify alternatives
All areas and options are listed. Business cases are presented.
4. Weigh the evidence
Alternatives are weighed against each other. Pros and cons are discussed.
5. Choose among the alternatives
Once you have weighed all the evidence, you are ready to select the alternative that seems best for the company. You may even choose a combination of alternatives.
6. Take action
You implement the chosen alternative. It is time for execution.
7. Review the decision
You review the results of the decision and see how your expansion plan is working out and iterate.
With prescriptive intelligence in place, the machine assisted decision-making process is similar, but at the same quite different as the effort lies in the beginning, and not the collection of information. We assume here you have access to a tool that combines market data with internal data.
1. Identify the decision
In which geographical area can we increase our revenue the most?
2. Goal formulation (prompting)
What are the results that you are looking to achieve and through what means. List interesting areas for exploration and factors you think are relevant.
3. Scenario evaluation
Alternatives and scenarios are simulated and presented by the AI describing the steps needed to reach formulated goal. Costs and risks are listed based on data that is available. You have the possibility to deep dive into areas to expand your analysis or follow the recommended path.
4. Weigh the scenarios
Recommendation is weighed against the other scenarios.
5. Scenario implementation
You implement the chosen scenario and measure against milestones and goals set by the AI.
6. Review the chosen scenario
The decision and chosen scenario are evaluated in real time with the AI to ensure ongoing learning and optimisation.
If we look past the fact that much of the decision-making process is automated, we move from hypothetical discussions around outcomes and consequences to an evaluation of the proposed steps to reach the decision and set goal. The proposed scenario is not unbiased and unemotional, it is guiding force explaining how to reach that goal with what is available.
Science fiction?
Prescriptive intelligence is not something we imagine anymore, it is being worked on today, and there are already solutions in the market for specific use cases. Our decision-making process will not only be faster (timewise), but we will also be able to be much more accurate in understanding outcomes and the decisions in between we need to make to reach a certain goal.
If everyone can afford the same tools and have access to the same data, isn't there a risk that we will all pull towards the same goals in our respective fields? Isn’t it all about increasing profit through expansion or decreasing costs?
The chances of that scenario are limited.
Not one company has the same data as another one. We can acquire datasets, predictions, but in the end how we operate, they people we employ, the decision we made, and our assets and business models are not the same. Each company has its own strategy, so even if we all access the same market intelligence, the outcome will be different. But just as generative AI has shown with ChatGPT and Midjourney, the playfield has become much more even.
Market analysis and expensive data is becoming less expensive and available to a larger extent of companies, and not only the big ones.
A general prescriptive analytics platform is still a couple of years in the future. At Tembi, we have built the data foundation for it, and are constantly working on adding new machine learning based prediction and econometric models to create better insights and foresights for our clients based on open data.
While companies have their internal data, we provide extensive access to open data, and ready-to-go-analytics – or market intelligence – that provide actionable insights to the decision-making process. Many of our clients use our API to connect their data with our data to examine and understand (i.e.) volume fluctuations (revenue drivers) with external events, and hence be able to understand how external factors impact their business, mitigate risk, or uncover new business possibilities.
The more we connect the world's Information the better we will understand the future, and the more impact our decisions will have. And that is why we work here at Tembi. Until we provide a general prescriptive intelligence platform for executing successful business decisions, we focus on providing market intelligence that is beyond what can be seen by a person online. We combine data from multiple industries and build market predictions models based on changes across different industries.
n today's data-driven world, the abundance of information and the advancement of analytical tools have sparked a competitive quest for insights. As data becomes more affordable and accessible, the ability to use this data effectively becomes a decisive factor in staying ahead. But having data is one thing; making sense of it to predict the future is quite another. It is a complex task that goes beyond just crunching numbers—it is about weaving together diverse parts of information, both old and new, to form a clear picture of what lies ahead.
This article aims to untangle the concept of Predictive Market Intelligence, demonstrating how it operates and its value in a business context. We will look at how this approach to data can lead to smarter decisions and how it is shaping the way companies move forward.
Predictive Market Intelligence (PMI) stands at the confluence where big data analytics, artificial intelligence, and advanced market research meet. It is the art and science of collecting vast amounts of open data - from (i.e.) market trends, company behaviour, to global economic indicators - and analysing them to forecast future market conditions. The aim of PMI is not only to investigate information based on past market performance – historical data – but to forecast the evolution of markets, specific industries, or companies, by employing diverse analytical methods and algorithms.
Unlike traditional market research, Predictive Market Intelligence is dynamic, constantly refining its insights with a steady stream of real-time data. This process enables businesses to not just interpret the present but also to anticipate and prepare for future market developments, gaining foresight and deepening their understanding of potential future scenarios.
If companies can use Predictive Market Intelligence to gain foresight, can PMI be applied everywhere, or are there particular interesting applications of this approach to market analysis and strategy? Here are a couple of examples:
Retrieving Market Intelligence is a question of gathering data from various sources, organising the gathered data, and applying different technologies to validate, enrich and put the data into context. The last step is to apply different analytical models depending what outcome one is looking for. So, where the first step is about gathering (open) data, the second analytical step is the creation of synthetic data (programmatically generated data).
Each step of the process, from open data to intelligence, uses different technologies. Each plays a unique role and function, but applied together, collectively, these technologies can create incredibly precise projections. Let us dive into a couple of them.
Central to Predictive Market Intelligence is the process of data mining and aggregation. This involves the meticulous gathering of vast volumes of data from a multitude of sources like public information, financial reports, and for example websites. The objective is to amass a comprehensive dataset that encapsulates the diverse aspects of the market and company behaviors. This rich tapestry of data forms the foundation upon which further analysis is built.
Artificial Intelligence (AI) and Machine Learning (ML) stand at the core of Predictive Market Intelligence, processing and interpreting the extensive data collected. AI algorithms are adept at discerning complex patterns and relationships within the data, which are often imperceptible to the human eye. Simultaneously, ML models, with their ability to learn and improve from the data, continuously refine their insights, ensuring they remain relevant and accurate in a rapidly changing market.
A key component in understanding context is Natural Language Processing (NLP). NLP technologies delve into text-based data, analysing news articles, pdfs, and websites. They are particularly effective in understanding the context of the written text, and being able to synthesis substantial amounts of data and help verify what the data is
Predictive analytics brings a forward-looking perspective to Predictive Market Intelligence. By employing statistical and econometric models as well as forecasting algorithms, it anticipates future market behaviors, trends, and company needs. This facet of Predictive Market Intelligence is instrumental in risk assessment and scenario planning, allowing businesses to prepare for various future market scenarios.
Big Data Analytics provides the muscle to process and analyze the immense datasets characteristic of Predictive Market Intelligence. It offers real-time analysis and sophisticated data visualization tools, making complex data understandable and actionable. Complementing this is cloud computing, which offers the necessary infrastructure for data storage and analysis. Its scalability ensures that businesses can adapt to varying data demands, while also offering cost-effective solutions compared to traditional in-house data centers.
Predictive Market Intelligence is not only for experts. With platforms such as Tembi, PMI is today accessible for everyone, regardless of analytical skill set. While there are use-cases that require tailormade algorithms, predictions such as company growth, market trends and econometric forecasts are already available. And with decision-ready market insights, companies can quickly adapt to a data-driven decision process without heavy investments.
For the expert, Predictive Market Intelligence serves as an advanced tool that complements and elevates their analytical skills. PMI can be used to validate hypotheses, refine models, and conduct in-depth analyses that underpin robust, strategic decisions.
The technology used in Predictive Market Intelligence lets experts quickly sort through and understand huge amounts of data. This means they can get a clear picture of how markets are changing, what competitors are doing, and how companies are behaving. With this kind of intelligence, experienced professionals can make accurate predictions and find new business opportunities before anyone else does.
For those new to Predictive Market Intelligence, it can seem both exciting and a bit overwhelming at first. But this technology simplifies the process of understanding the market by turning complicated ideas into clear insights. It provides easy-to-use tools and clear visuals that help make sense of complex data.
With Predictive Market Intelligence, even those just starting out can get a complete view of the market. They'll learn to spot the important signs that show changes in what consumers want or in the economy. This technology is like having a guide and a coach in one, helping new users think strategically and make decisions based on data.
Predictive Market Intelligence acts as a bridge between theory and practice, enabling a fluid exchange of knowledge across all levels of expertise. It is a field that values the knowledge of the expert and nurtures the growth of the newcomer. By fostering an environment where learning is continuous and insights are accessible, Predictive Market Intelligence ensures that all users, regardless of their level of expertise, can contribute to and benefit from the intelligence it provides.
The future of Predictive Market Intelligence looks particularly promising as cloud computing costs, which have been a significant factor in the past, are expected to continue their trend towards more economical and efficient services. As the price-performance ratio of technologies like GPUs improves, companies can leverage more powerful analytical capabilities at a lower cost. This could further democratize PMI, allowing smaller businesses to engage with what was only accessible to larger corporations. The integration of emerging technologies such as distributed cloud and advanced AI (Artificial Intelligence) algorithms will further enhance PMI's accuracy and speed, offering businesses of all sizes the predictive insights needed to stay ahead in an increasingly data-centric world.
What will be key, as always with the development of analytics and AI, is the quality and the amount of data. With a democratization of technology, the winners will be the ones that invest in good data gathering processes – both internal and external open data – and have solid data partnerships in place.
One thing is sure, we have only touched the very beginning of this approach. But already today, it is evident that companies that utilize external data in their decision process, have far better chances of making better decisions. Giving them a better competitive edge.
MIA is Tembi’s new agentic Market Intelligence Analyst for e-commerce: an AI-powered analyst that answers complex questions on e-commerce and last-mile delivery by analysing Tembi’s proprietary data from more than one million monitored webshops across Europe. It is built for commercial, strategy and product teams who need to see how markets, competitors and propositions are changing, without waiting for bespoke reports or building complex queries.
MIA turns Tembi’s market-scale e-commerce and last-mile data into something teams can interrogate in real time, not just receive in periodic reports. Instead of working around fixed dashboards, commercial, strategy and product teams can ask complex questions directly and see how markets, competitors and propositions are actually moving across Europe.
A typical workflow might start from a broad question like “Where have delivery propositions changed most in the last quarter?” and quickly narrow down to specific markets, segments or retailers. The analysis follows the question as it evolves, rather than forcing the question to fit a predefined view.
MIA acts like a market analyst orchestrated by a set of specialised AI agents that work directly on top of Tembi’s continuously monitored dataset of more than one million webshops across 23 European markets. When you ask a question, MIA is prompted with your query and an intent understanding agent interprets what you are really asking: the entities involved, the time horizon, the level of detail and the types of comparisons implied.
Based on that intent, MIA calls a data retrieval agent that knows how to navigate Tembi’s proprietary e-commerce and last-mile delivery data, select relevant retailers, markets, time periods and attributes, and assemble a fit-for-purpose dataset for the task. An analysis agent then applies appropriate methods – from simple aggregations and time series comparisons to mix shifts and provider presence views – and turns the results into structured outputs such as charts, graphs and allows users to build multi view dashboards that match the original question.
Throughout this process, MIA keeps the link between the analysis and the underlying data, so every result remains traceable back to specific retailers, webshops and time periods. If you need to validate or challenge a finding, you can move from an aggregate pattern (for example, “delivery options expanding in a given market”) down to the individual webshops that support that conclusion.
MIA follows the way analysts and commercial teams naturally work: start broad, refine, then package the results for others.
Read more about Agentic Analytics
MIA is possible because of Tembi’s underlying data foundation. Tembi continuously monitors more than one million European webshops and revisits each one roughly every two weeks to capture how assortments, brands, delivery methods, checkout setups and other attributes change over time.
That cadence turns e-commerce and last-mile delivery into a moving picture rather than a static snapshot. MIA brings an analyst layer on top of this, so instead of navigating raw complexity, teams can work with focused, question driven analysis that stays anchored in real, current market behaviour.
Explore an analysis of the Italian last-mile market done with MIA.
MIA is rolling out to selected Tembi customers from January 2026, with broader availability planned for March 2026. If your team works with e-commerce or last-mile delivery and wants analyst like access to Tembi’s market-scale data, you can register interest for early access on the MIA product page or by contacting Tembi at hello@tembi.io.
Interested in getting a demo, contact us and we'll set it up.
Spain counts 89,038 active online retailers, with clothes & shoes leading the category mix, an estimated +1,2bn parcels/year, and average delivery prices at €4,9 (home) vs €4,4 (OOH) for lightweight items. Our new Spain report maps the market structure, checkout dynamics, delivery methods, and how the main carriers compete for visibility - including the often-overlooked impact of white-label checkouts.
If you’re working in last-mile delivery and want a competitive view of Spain, download the full report here.
This report focuses on nine of the largest delivery providers in Spain: Correos / Correos Express, MRW, GLS, SEUR/DPD/Tipsa, DHL, NACEX, FedEx/TNT, CTT, and InPost/Mondial Relay. End-to-end retail & logistics operators (e.g., Amazon) and smaller/specialised operators (refrigerated, oversized, etc.) are intentionally excluded to keep the comparison clean and actionable.
All figures are based on Tembi’s continuous monitoring and analysis of Spanish online retailers and checkout setups, with consistent classification to support like-for-like analysis across markets. Use it to maintain competitive advantage, capture share in attractive segments, and understand market dynamics with clarity.
Quick takeaways
Spain is home to nearly 90,000 active online retailers, with a long tail that still produces meaningful parcel demand - and a smaller set of large/very large retailers that set service expectations (speed, returns, OOH availability, and delivery choice). Category-wise, Spain’s retailer base is led by clothes and shoes (~12,19%), followed by health & medicine (~7,04%) and beauty & personal care (~6,3%).
In Spain, share of presence (where a provider appears as an option in checkout) is heavily led by Correos / Correos Express, which shows up across ~41% of branded checkouts in our dataset, far ahead of the next tier (MRW, GLS, SEUR/DPD/Tipsa).
But presence is only half the story. In checkout, position matters.
Across Spanish webshops where delivery provider brands are visible, Correos / Correos Express holds the first position most frequently (33,1%), followed by GLS (20,9%) and SEUR / DPD / Tipsa (13,3%). MRW (11,2%) and NACEX (8,0%) follow, with DHL (5,8%) and smaller shares for others.
If you read our Italy last-mile delivery analysis, you’ll recognise the same core idea: the checkout is the battlefield. The winners aren’t only those with the biggest networks - they’re the providers most consistently prioritised where consumers actually make the choice - why checkout position and visibility are a key differentiators in revenue and brand building.
Here is the uncomfortable truth for last-mile brands: a large share of Spanish retailers don’t show carrier names at all - they show only delivery methods and prices.
This matters because it means “market share” can look very different depending on whether you measure parcel volumes, merchant relationships, or brand visibility to consumers. For carriers, improving brand exposure inside white-label environments is one of the largest untapped levers in Spain - because it’s not a network problem, it’s a checkout/integration problem.
Across the market, home delivery is still the default, and the regulator view aligns with what we see in retailer setups: CNMC reports that in 2024 the usual delivery place was home (68,9%), with PUDO/convenience points (13,6%) and lockers (3,8%).
When we look at delivery methods displayed across retailers (excluding white-label checkouts), the same story holds: OOH is present, but underbuilt - especially compared to where Spain could go given consumer density and the cost-to-serve logic that OOH enables.
And pricing reinforces the direction of travel: for lightweight items, average delivery prices are roughly €4,9 (home) vs €4,3–€4,5 (OOH) depending on parcel shop vs locker. Spain is also cheaper than Italy across all options, which changes the “room” carriers have to subsidise adoption - but not the underlying incentive to densify OOH.
While retailers set the price shown in checkout, these figures consistently reflect provider positioning.
Not all “presence” is equal. The value of a provider’s retailer base depends on who those retailers are.
Using Tembi’s size scoring (0–100), we can see clear portfolio skews:
Category exposure shows the same idea from a different angle: providers aren’t just “generalists” - each ends up with a distinct category footprint (e.g., stronger concentration in health & medicine, fashion, electronics, etc.)
Finally, our Growth Indicator model adds a forward-looking layer: DHL and InPost have the strongest growth-weighted portfolios, with 56% and 54% of their clients forecast to be in high or very high growth bands. Correos shows a more balanced mix across growth bands.
If you want the practical “so what” for Spain, three things stand out:
Spain’s last-mile market is large, competitive, and still structurally under-optimised in checkout. Correos dominates branded presence and first-position frequency, white-label checkouts hide a big part of the market, and OOH remains a clear runway - with meaningful differences in portfolio quality and growth potential across providers.
Download the full Spain report, or schedule a Tembi demo to see your competitive landscape updated continuously across markets - including comparisons to our Italy analysis
Italy counts 94,724 online retailers, with clothing, groceries and beauty leading the mix, average home delivery cost at €6.5 and OOH at €5.8. With continued investment and InPost’s strong market entry, OOH delivery is expanding rapidly and reshaping the competitive landscape. This Italian last-mile delivery market analysis maps the structure, methods and provider portfolios behind the numbers.
Working in last-mile delivery and interested in another competitive market analysis beyond Italy? Let's connect. Download the full report here.
Italy remains one of Europe’s most active e-commerce markets by merchant count and parcel flow. To help last-mile executives benchmark strategy, this report profiles the market composition, delivery method availability and pricing, and the competitive landscape across six core providers: GLS, Poste Italiane, DPD BRT, DHL, InPost, and FedEx (TNT). You’ll see where demand concentrates by category, how pricing positions each method, and how provider client portfolios skew by retailer size and expected growth.
All figures are derived from Tembi’s continuous monitoring and analysis of Italian online retailers and checkout setups, with consistent taxonomy and normalisation to support like-for-like comparisons. Use it to maintain competitive advantage, capture share in attractive segments, and understand market dynamics with clarity.
Quick takeaways
Italy’s 94,724-strong retailer base skews to clothes & shoes (≈12.1%), then food & groceries (≈6.7%), and beauty (≈5.4%). The size pyramid shows most merchants are medium, fewer large, and about 1% very large, indicating a wide long-tail with concentrated head accounts that influence parcel mix and service expectations. The latest available data from 2020 suggest that around 830 million parcels are shipped domestically each year. Given the latest e-commerce growth estimation of an average annual growth rate of 4.5%, parcel volumes could now be approaching one billion shipments.
GLS and Poste Italiane hold the broadest presence across Italian webshops - GLS appears in 48.7% of retailer checkouts and Poste Italiane in 46.3%. DPD BRT, DHL, InPost, and FedEx (TNT) follow, forming the rest of the competitive landscape.
When looking at the first delivery option offered to shoppers, GLS leads with roughly 30%, followed by DPD BRT (26%) and Poste Italiane (22%).This ordering pattern reflects how retailers prioritise providers based on network reach, reliability, and negotiated terms rather than pure visibility.
In short:
Across Italian retailers, home delivery remains dominant, offered by roughly 89% of webshops. Parcel shops (≈9%) and parcel lockers (≈3%) are still at an early stage of rollout, but both formats are expanding as networks and integrations mature.
The limited share of OOH options reflects the market’s current infrastructure capacity rather than consumer demand alone. With continued investment from providers such as InPost, Poste Italiane, and DPD BRT, OOH coverage is expected to increase steadily over the next few years, giving retailers broader flexibility in how they structure delivery choices and costs.
Pricing across delivery methods follows a clear hierarchy. Home delivery is the most expensive, with DHL and FedEx (TNT) positioned at the higher end in line with their express and international focus.GLS, Poste Italiane, and DPD BRT sit around the market average, reflecting large-scale domestic coverage and standardised pricing structures. InPost maintains the lowest price levels across OOH deliveries, consistent with its parcel-locker model and high network density.
The pricing gap between home and OOH - €6.5 vs €5.8 on average - highlights the economic rationale for providers to keep expanding out-of-home capacity, and in line with most other markets. As networks grow denser, these price differences will continue to influence retailer delivery mix.
Tembi’s analysis segments retailer clients by size and growth outlook, showing how each provider’s portfolio is positioned across the Italian market.
This chart summarises the average retailer size of each provider’s client base on Tembi’s 0–100 scale, where higher scores represent larger and more established webshops.
The stacked bars show how each delivery provider’s clients are distributed by retailer size:
Using Tembi’s forward-looking Growth Indicator - a composite of product portfolio development, traffic momentum, financial proxies, and export activity - InPost has the highest share of high- and very-high-growth retailers, reflecting its alignment with fast-scaling digital merchants. DHL also skews towards higher-growth segments, supported by its express and cross-border strengths. Meanwhile, GLS, Poste Italiane, and DPD BRT hold proportionally larger bases of mature retailers, providing stability and recurring parcel volume.
Locker and parcel shop networks are entering a phase of rapid expansion across Italy.InPost leads with more than 3,000 lockers installed at the start of 2025. DHL and Poste Italiane jointly reported around 500 lockers by mid-2025, alongside an ambitious plan to reach 10,000 units in the coming years. DPD BRT, through its Fermopoint network, aims for up to 4,000 lockers within five years, while GLS initiated its own rollout during 2025.
This coordinated investment places Italy on a clear multi-year OOH growth trajectory, reshaping how carriers balance cost, capacity, and customer reach. The build-out is not just a convenience upgrade; it’s a structural shift in network economics - each new locker or parcel shop reduces last-mile cost per parcel and expands delivery capacity in urban areas.
Why it matters
Rising locker and parcel shop density directly influences:
As the network matures, OOH will become a central component of Italy’s last-mile infrastructure, shaping both consumer choice and carrier efficiency.
Tembi’s analysis highlights three practical dimensions that matter for market strategy and portfolio alignment.
1. Segment by retailer size and category
Italy’s retailer landscape is dominated by small and medium merchants, but larger and premium-category retailers - such as fashion, beauty, and consumer electronics - set higher expectations for service speed, reliability, and returns. Delivery providers should align SLAs, OOH coverage, and returns management to match those standards while maintaining efficient access to the long tail.
2. Model the price–mix effect
With home delivery averaging €6.5 and OOH €5.8, even a modest shift in checkout mix can materially improve cost-to-serve for both carriers and retailers. Tracking these dynamics by category and region helps identify where OOH incentives or dynamic checkout sequencing can achieve measurable margin impact.
3. Track portfolio momentum
Provider client portfolios differ in growth exposure. InPost and DHL are more concentrated among high-growth retailers, while GLS, Poste Italiane, and DPD BRT anchor the market’s stable core. Monitoring these shifts over time helps providers balance predictable SMB volume with faster-growing digital retailers, ensuring coverage across both maturity extremes.
Italy’s last-mile market is broad, price-competitive, and evolving. Method economics continue to favour OOH expansion as networks densify; provider portfolios show divergent exposures across retailer size and growth; and the locker build-out marks a long-term structural transformation rather than a short-term initiative.
This Italian last-mile delivery market analysis outlines the market map and comparative signals needed to inform planning, benchmarking, and partnership strategies across the sector.
Download the full Italian market report or schedule a Tembi demo to see your competitive view updated continuously.
Delivery fees across the Nordics have followed clear seasonal patterns and strategic adjustments over the past two years. Drawing on data from over100,000 webshops in Sweden, Denmark, Finland, and Norway between Q1 2024 and Q32025, we track how average consumer delivery prices (in EUR) have shifted.
This analysis zooms in on the Q4 holiday peak, highlights country-specific behaviours, and compares delivery methods in urban areas - parcel lockers, pickup points, and home delivery. The aim is to show how webshops shape their pricing strategies and how these evolve through the year.
Seasonality is a defining feature of delivery pricing in the Nordics. Q4, the peak holiday quarter, typically brings stable or higher fees rather than discounts. In late 2024, Black Friday and Christmas did not lead to cheaper delivery - instead, many webshops kept prices firm or lifted them slightly.
· Sweden: average home delivery rose from €7.60 in Q3 2024 to €8.00 in Q4, the annual peak.
· Denmark: small increases, such as parcel shop delivery at €5.89 in Q4 versus €5.83 inQ3.
· Finland: parcel shop fees jumped by around 5% in Q4 2024.
· Norway: parcel box delivery peaked during the holiday quarter.
The pattern suggests that in high-demand Q4, retailers prioritise covering fulfilment costs over cutting fees - even when running heavy sales campaigns.
This shifts in Q1, when prices correct downward. After the holiday rush, many webshops reduced or normalised fees:
This Q1 softness reflects the post-holiday slowdown in demand and renewed competition to attract consumers during a quieter season.
Q4 2024 stands out as a high point for delivery fees in several markets, corroborating that peak season surcharges and fewer free-shipping promos were in effect. In fact, during Black Week (Black Friday 2024), retailers across Noridcs reduced the prevalence of free shipping by 4% compared to 2023, opting instead to set spend thresholds or promote premium paid options (source: ingrid.com). In other words, fewer orders enjoyed “free delivery” in Q4 2024, as merchants nudged customers toward paid faster delivery or order bundling.This strategic move helped protect margins during the holiday boom – and consumers generally went along, paying for delivery when the value (speed, convenience) was clear (source: ingrid.com). The seasonal insight here is that peak demand doesn’t equal cheaper shipping; if anything, many webshops use the period to upsell premium delivery or maintain prices, rather than offer blanket free shipping.
Moving through 2025, the Q2 and Q3 2025 data show an interesting reset. By summer 2025, average delivery charges in many categories fell back to or below their levels from the previous holiday season. This sets the stage for how Q4 2025 might play out – which we’ll discuss in a moment.
Each Nordic market shows distinct pricing dynamics, shaped by competition, consumer behaviour, and delivery costs.
Swedish webshops consistently post the lowest delivery fees in the region.In early 2024, prices were modest - around €4.20 for locker delivery and €7.50 for home delivery. These rose steadily through the year, with parcel box and parcel shop deliveries more than 20% higher by Q3/Q4. Home delivery peaked at €8.00 in Q42024, reflecting inflationary pressures and webshop/carriers passing higher rates on to consumers.
In 2025, the trend reversed. By Q3 2025, parcel shop delivery had dropped from €6.57 in Q4 2024 to €5.37 (an 18% decline),while home delivery eased back to €7.59. This points to intensifying competition, with Swedish retailers willing to cut delivery prices quickly to gain an edge.
Denmark’s delivery pricing remained stable through 2024, with parcel lockers and pickup points in the mid-€5 range and home delivery around €7.80–7.90. Even in Q4, increases were marginal- for example, parcel shop delivery at €5.89 in Q4 versus €5.83 in Q3.
The shift came in 2025. By Q3, parcel lockers averaged €5.00 and parcel shops €5.11 - 10–13% lower than the prior holiday season. Home delivery also dipped to €7.30 from €7.91 in Q4 2024. This gradual decline suggests Danish webshops began competing more actively on delivery price or carriers pressed the prices further down.
Finland remains the most expensive Nordic market for delivery - especially for home delivery. In 2024, Finnish shoppers paid €12–13 for home delivery, nearly double Sweden’s average. Out-of-home methods were also high at €7+. Prices climbed steadily through 2024, with parcel shops up 12% by Q4.
In 2025, home delivery crept even higher, peaking at €12.90 in Q2. But by Q3, parcel locker and shop fees had fallen sharply - down about 10% from Q2, back to early-2024 levels. Home delivery stabilised around€12.50.
Norway experienced the most pronounced swings. In 2024, home delivery peaked at €10.08 in Q2, while parcel lockers (€8.21) and parcel shops (€9.16) hit highs in Q3. Interestingly, Q4 home delivery was lower than earlier in the year at €9.55.
By 2025, Norwegian webshops had cut prices heavily, especially for out-of-home delivery. Parcel lockers fell from over €8in late 2024 to €6.64 by Q3 2025- a 20% year-on-year drop. Parcel shop delivery followed a similar pattern, down about €1.20 on average versus Q4 2024. Home delivery also eased slightly to €9.25 by Q3.
The widening price gap between home and pickup options suggests a deliberate push to shift volume to more cost-efficient methods. For carriers, Norway highlights how quickly competitive conditions can change - and the need to adjust pricing strategies in real time.
To summarize the country trends, Table 1 highlights how delivery fees in Q3 2025 compare to the last peak season (Q42024). Most markets saw notable declines in that period, especially for out-of-home deliveries:
Data clearly shows that out-of-home delivery is significantly cheaper for consumers in urban areas – a natural effect when carriers can deliver 5–10 times more parcels per driver compared with home delivery.
Parcel box (locker) delivery
· Cheapest option across all markets by 2025(~€5–6.5).
· Prices spiked in 2024 (e.g. Norway €6.6 → €8.3)but dropped back sharply in 2025.
· Volatility suggests retailers test price sensitivity, then reset as competition kicks in.
Parcel shop(pickup point) delivery
· Typically a few cents above lockers, but fell notably in 2025.
· Norway: from ~€9 in 2024 to €7.2 by Q3 2025.
· Pricing gap with home delivery widened, creating strong incentives for consumers to choose pickup.
Home delivery
· Premium service, consistently the most expensive.
· Held steady through 2024–25: ~€7.5 in SE/DK,~€9.3 in NO, ~€12.5 in FI.
· Only small price drops, with Sweden (-13% YoY)the exception.
· Discounts remain rare and tied to high order values.
Out-of-home delivery became cheaper in 2025, while home delivery kept its premium. This reflects a conscious decision: steer demand towards lockers and pickup points to cut last-mile costs and ease peak-season pressure. Black Week 2024 showed the effect in practice - locker usage rose by four percentage points and delivery times improved as shoppers embraced flexible collection (source: ingrid.com).
For logistics providers and retailers, aggressive pricing on out-of-home delivery seems to become a core lever: it nudges cost-conscious consumers, reduces operational strain, while keeping satisfaction high. But the gap has limits - home delivery still anchors convenience expectations and remains a profit lever. The real challenge is balance: keeping lockers and pickups highly attractive without eroding the value or accessibility of home delivery.
Collaboration between retailers and logistics providers is key here, ensuring service levels meet expectations as more customers choose out-of-home - seen clearly during Black Week, when lockers not only gained share but also delivered faster on average (source: ingrid.com).
To keep the forecast transparent, we applied a simple model: for each country × delivery method, we took the Q4-over-Q3 seasonal change from 2024 and applied that ratio to Q3 2025 levels. Where 2025 trended lower than 2024, we also include a conservative midpoint between Q3 2025 and that baseline.
· Parcel box(lockers): €5.6–6.0
· Parcel shop(pickup): €6.1–6.3
· Home delivery: €9.0–9.2
Seasonal lift from Q3 to Q4 looks modest. Home delivery remains the premium option, while lockers and parcel shops stay clearly cheaper.
· Sweden: home ~€8.0 (flat vs last year); parcel shop ~€5.3 and lockers ~€5.0 (well below last year).
· Denmark: home ~€7.4; parcel shop ~€5.2; lockers ~€5.1 (all lower than last year).
· Finland: home ~€12.5 (still high); parcel shop ~€7.3; lockers ~€6.4 (both down year-on-year).
· Norway: home ~€9.25 (slightly below last year); parcel shop ~€7.1; lockers ~€6.7 (~20%down year-on-year).
Nordic delivery prices have eased through 2025 after peaking in late 2024, especially for out-of-home options (parcel box and parcel shop). Applying last year’s Q4-over-Q3 seasonality to current Q3 levels points to only small Q4 uplifts: lockers and pickups remain the low-cost choices, while home delivery stays premium and broadly flat.
Country patterns matter. Sweden and Denmark have lower 2025 bases and limited room for Q4 increases. Finland remains structurally high - especially on home delivery - so stability is more likely than hikes. Norway has corrected sharply this year, with retailers continuing to nudge volume toward cheaper lockers and pickups.
The underlying pricing strategies are clear:
· Continued shift to out-of-home delivery. Lower pricing here is deliberate - directing volume away from costly home delivery and easing last-mile strain.
· Home delivery as a premium anchor. Price cuts are modest; competition is about service quality (slots, ETAs, first-attempt success) rather than cents.
· Seasonal resets. After Christmas, prices ease in Q1—a cycle webshops use to stay competitive in slower months.
Finally, weigh this outlook against external factors that can quickly shift the picture: capacity constraints and consumer sentiment. If sentiment weakens, retailers may lean harder on thresholds and targeted incentives.
.png)
