


n commercial real estate, having the right insights can lead to valuable opportunities. Tembi's new report, "Netherlands Relocation Data & Predictions 2025," offers practical understanding and insights into upcoming shifts in the commercial real estate space.
Tembi’s AI-driven analytics blend market dynamics, employment patterns, and historical data to deliver accurate and reliable market forecasts.
Find new tenants proactively with relocation predictions
Our analysis highlights 9,993 companies in the Netherlands likely to relocate during 2025, potentially affecting over 222,000 employees. Another 21,532 companies might also move offices within the next year, impacting nearly 700,000 employees.
Understand how areas develop
Showing a clear understanding of local trends can enhance your credibility with clients. Our report details areas gaining or losing businesses, like Utrecht, Amsterdam-Duivendrecht, and Rotterdam. This information can help you deliver pitches that clearly match your clients' strategic interests.
Make informed decisions with clear market insights
Download the report today to stay informed about relocation trends, helping you anticipate market changes, uncover new opportunities, and stay ahead in your field.
Get the full report: Netherlands Relocation Data & Predictions 2025
Are you interested in getting more data and see how Tembi can you help you grow, talk to our sales team.
More from
Market Intelligence
category


Spain counts 89,038 active online retailers, with clothes & shoes leading the category mix, an estimated +1,2bn parcels/year, and average delivery prices at €4,9 (home) vs €4,4 (OOH) for lightweight items. Our new Spain report maps the market structure, checkout dynamics, delivery methods, and how the main carriers compete for visibility - including the often-overlooked impact of white-label checkouts.
If you’re working in last-mile delivery and want a competitive view of Spain, download the full report here.
Spanish last-mile delivery market analysis
This report focuses on nine of the largest delivery providers in Spain: Correos / Correos Express, MRW, GLS, SEUR/DPD/Tipsa, DHL, NACEX, FedEx/TNT, CTT, and InPost/Mondial Relay. End-to-end retail & logistics operators (e.g., Amazon) and smaller/specialised operators (refrigerated, oversized, etc.) are intentionally excluded to keep the comparison clean and actionable.
All figures are based on Tembi’s continuous monitoring and analysis of Spanish online retailers and checkout setups, with consistent classification to support like-for-like analysis across markets. Use it to maintain competitive advantage, capture share in attractive segments, and understand market dynamics with clarity.
Quick takeaways
- Market scale: 89,038 active online retailers; +1,2bn parcels/year; e-commerce CAGR (2019–2024) estimated at ~14,3%.
- White-label: A majority of retailers hide carrier brands in checkout (white-label) - a major visibility opportunity for carriers.
- Competitive landscape: Correos / Correos Express leads by share of presence and also wins the first checkout position most often; GLS and SEUR/DPD/Tipsa follow.
- Delivery prices: Average lightweight delivery prices sit around €4,9 home vs €4,4 OOH, with OOH still underpenetrated.
Market overview: size, growth & drivers
Spain is home to nearly 90,000 active online retailers, with a long tail that still produces meaningful parcel demand - and a smaller set of large/very large retailers that set service expectations (speed, returns, OOH availability, and delivery choice). Category-wise, Spain’s retailer base is led by clothes and shoes (~12,19%), followed by health & medicine (~7,04%) and beauty & personal care (~6,3%).

Delivery provider landscape: who dominates?
In Spain, share of presence (where a provider appears as an option in checkout) is heavily led by Correos / Correos Express, which shows up across ~41% of branded checkouts in our dataset, far ahead of the next tier (MRW, GLS, SEUR/DPD/Tipsa).
But presence is only half the story. In checkout, position matters.
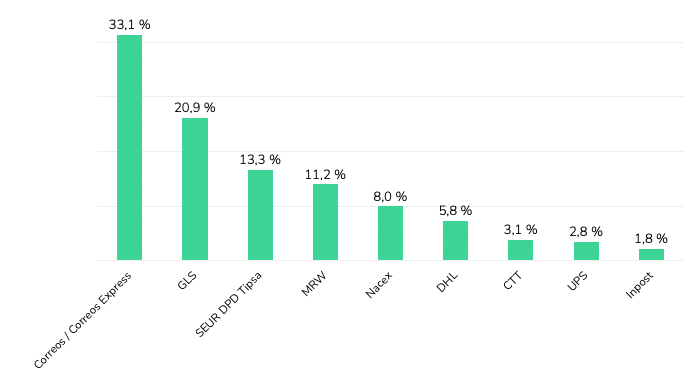
Across Spanish webshops where delivery provider brands are visible, Correos / Correos Express holds the first position most frequently (33,1%), followed by GLS (20,9%) and SEUR / DPD / Tipsa (13,3%). MRW (11,2%) and NACEX (8,0%) follow, with DHL (5,8%) and smaller shares for others.
If you read our Italy last-mile delivery analysis, you’ll recognise the same core idea: the checkout is the battlefield. The winners aren’t only those with the biggest networks - they’re the providers most consistently prioritised where consumers actually make the choice - why checkout position and visibility are a key differentiators in revenue and brand building.
White-label checkouts: the hidden market
Here is the uncomfortable truth for last-mile brands: a large share of Spanish retailers don’t show carrier names at all - they show only delivery methods and prices.
- In the broader dataset view, over 62% of retailers run delivery options in a way that hides carrier brands.
- In the size-categorised subset (76,615 retailers), 58% use white-label checkout, and the share varies by retailer size.
This matters because it means “market share” can look very different depending on whether you measure parcel volumes, merchant relationships, or brand visibility to consumers. For carriers, improving brand exposure inside white-label environments is one of the largest untapped levers in Spain - because it’s not a network problem, it’s a checkout/integration problem.

Delivery methods: home still dominates, OOH is growing
Across the market, home delivery is still the default, and the regulator view aligns with what we see in retailer setups: CNMC reports that in 2024 the usual delivery place was home (68,9%), with PUDO/convenience points (13,6%) and lockers (3,8%).
When we look at delivery methods displayed across retailers (excluding white-label checkouts), the same story holds: OOH is present, but underbuilt - especially compared to where Spain could go given consumer density and the cost-to-serve logic that OOH enables.
And pricing reinforces the direction of travel: for lightweight items, average delivery prices are roughly €4,9 (home) vs €4,3–€4,5 (OOH) depending on parcel shop vs locker. Spain is also cheaper than Italy across all options, which changes the “room” carriers have to subsidise adoption - but not the underlying incentive to densify OOH.

Pricing patterns by method and provider
While retailers set the price shown in checkout, these figures consistently reflect provider positioning.
- Home delivery is generally the most expensive method.
- DHL sits at the upper end (consistent with express and international positioning).
- GLS, SEUR/DPD, and NACEX cluster around the market average.
- Correos is typically offered as one of the cheaper options.

Provider portfolios: size mix, category mix, and growth potential
Not all “presence” is equal. The value of a provider’s retailer base depends on who those retailers are.
Using Tembi’s size scoring (0–100), we can see clear portfolio skews:
- InPost and DHL have the highest average webshop size scores (both ~high-50s), meaning their client bases lean larger.
- CTT also skews larger.
- MRW is most weighted towards smaller retailers.
- Correos, SEUR/DPD/Tipsa, GLS, and NACEX sit closer to the market middle.

Category exposure shows the same idea from a different angle: providers aren’t just “generalists” - each ends up with a distinct category footprint (e.g., stronger concentration in health & medicine, fashion, electronics, etc.)
Finally, our Growth Indicator model adds a forward-looking layer: DHL and InPost have the strongest growth-weighted portfolios, with 56% and 54% of their clients forecast to be in high or very high growth bands. Correos shows a more balanced mix across growth bands.
Strategic implications for market planning
If you want the practical “so what” for Spain, three things stand out:
- Treat white-label checkout as a growth surface
With most retailers hiding carrier brands, increasing visibility isn’t just marketing - it’s product, partnerships, and integration strategy. - OOH is still early, and it will reshape the economics
Spain’s home-dominant delivery mix is not a fixed state. As locker and parcel shop networks densify, both carrier cost-to-serve and retailer checkout strategy will shift. - Benchmark portfolios, not just presence
Provider footprints differ by retailer size, category exposure, and growth outlook. If you’re not tracking that mix, you’ll misread where your future parcel volume will come from.
Conclusion
Spain’s last-mile market is large, competitive, and still structurally under-optimised in checkout. Correos dominates branded presence and first-position frequency, white-label checkouts hide a big part of the market, and OOH remains a clear runway - with meaningful differences in portfolio quality and growth potential across providers.
Download the full Spain report, or schedule a Tembi demo to see your competitive landscape updated continuously across markets - including comparisons to our Italy analysis
Spain counts 89,038 active online retailers, with clothes & shoes leading the category mix, an estimated +1,2bn parcels/year, and average delivery prices at €4,9 (home) vs €4,4 (OOH) for lightweight items. Our new Spain report maps the market structure, checkout dynamics, delivery methods, and how the main carriers compete for visibility - including the often-overlooked impact of white-label checkouts.
If you’re working in last-mile delivery and want a competitive view of Spain, download the full report here.
Spanish last-mile delivery market analysis
This report focuses on nine of the largest delivery providers in Spain: Correos / Correos Express, MRW, GLS, SEUR/DPD/Tipsa, DHL, NACEX, FedEx/TNT, CTT, and InPost/Mondial Relay. End-to-end retail & logistics operators (e.g., Amazon) and smaller/specialised operators (refrigerated, oversized, etc.) are intentionally excluded to keep the comparison clean and actionable.
All figures are based on Tembi’s continuous monitoring and analysis of Spanish online retailers and checkout setups, with consistent classification to support like-for-like analysis across markets. Use it to maintain competitive advantage, capture share in attractive segments, and understand market dynamics with clarity.
Quick takeaways
- Market scale: 89,038 active online retailers; +1,2bn parcels/year; e-commerce CAGR (2019–2024) estimated at ~14,3%.
- White-label: A majority of retailers hide carrier brands in checkout (white-label) - a major visibility opportunity for carriers.
- Competitive landscape: Correos / Correos Express leads by share of presence and also wins the first checkout position most often; GLS and SEUR/DPD/Tipsa follow.
- Delivery prices: Average lightweight delivery prices sit around €4,9 home vs €4,4 OOH, with OOH still underpenetrated.
Market overview: size, growth & drivers
Spain is home to nearly 90,000 active online retailers, with a long tail that still produces meaningful parcel demand - and a smaller set of large/very large retailers that set service expectations (speed, returns, OOH availability, and delivery choice). Category-wise, Spain’s retailer base is led by clothes and shoes (~12,19%), followed by health & medicine (~7,04%) and beauty & personal care (~6,3%).
Delivery provider landscape: who dominates?
In Spain, share of presence (where a provider appears as an option in checkout) is heavily led by Correos / Correos Express, which shows up across ~41% of branded checkouts in our dataset, far ahead of the next tier (MRW, GLS, SEUR/DPD/Tipsa).
But presence is only half the story. In checkout, position matters.
Across Spanish webshops where delivery provider brands are visible, Correos / Correos Express holds the first position most frequently (33,1%), followed by GLS (20,9%) and SEUR / DPD / Tipsa (13,3%). MRW (11,2%) and NACEX (8,0%) follow, with DHL (5,8%) and smaller shares for others.
If you read our Italy last-mile delivery analysis, you’ll recognise the same core idea: the checkout is the battlefield. The winners aren’t only those with the biggest networks - they’re the providers most consistently prioritised where consumers actually make the choice - why checkout position and visibility are a key differentiators in revenue and brand building.
White-label checkouts: the hidden market
Here is the uncomfortable truth for last-mile brands: a large share of Spanish retailers don’t show carrier names at all - they show only delivery methods and prices.
- In the broader dataset view, over 62% of retailers run delivery options in a way that hides carrier brands.
- In the size-categorised subset (76,615 retailers), 58% use white-label checkout, and the share varies by retailer size.
This matters because it means “market share” can look very different depending on whether you measure parcel volumes, merchant relationships, or brand visibility to consumers. For carriers, improving brand exposure inside white-label environments is one of the largest untapped levers in Spain - because it’s not a network problem, it’s a checkout/integration problem.
Delivery methods: home still dominates, OOH is growing
Across the market, home delivery is still the default, and the regulator view aligns with what we see in retailer setups: CNMC reports that in 2024 the usual delivery place was home (68,9%), with PUDO/convenience points (13,6%) and lockers (3,8%).
When we look at delivery methods displayed across retailers (excluding white-label checkouts), the same story holds: OOH is present, but underbuilt - especially compared to where Spain could go given consumer density and the cost-to-serve logic that OOH enables.
And pricing reinforces the direction of travel: for lightweight items, average delivery prices are roughly €4,9 (home) vs €4,3–€4,5 (OOH) depending on parcel shop vs locker. Spain is also cheaper than Italy across all options, which changes the “room” carriers have to subsidise adoption - but not the underlying incentive to densify OOH.
Pricing patterns by method and provider
While retailers set the price shown in checkout, these figures consistently reflect provider positioning.
- Home delivery is generally the most expensive method.
- DHL sits at the upper end (consistent with express and international positioning).
- GLS, SEUR/DPD, and NACEX cluster around the market average.
- Correos is typically offered as one of the cheaper options.
Provider portfolios: size mix, category mix, and growth potential
Not all “presence” is equal. The value of a provider’s retailer base depends on who those retailers are.
Using Tembi’s size scoring (0–100), we can see clear portfolio skews:
- InPost and DHL have the highest average webshop size scores (both ~high-50s), meaning their client bases lean larger.
- CTT also skews larger.
- MRW is most weighted towards smaller retailers.
- Correos, SEUR/DPD/Tipsa, GLS, and NACEX sit closer to the market middle.
Category exposure shows the same idea from a different angle: providers aren’t just “generalists” - each ends up with a distinct category footprint (e.g., stronger concentration in health & medicine, fashion, electronics, etc.)
Finally, our Growth Indicator model adds a forward-looking layer: DHL and InPost have the strongest growth-weighted portfolios, with 56% and 54% of their clients forecast to be in high or very high growth bands. Correos shows a more balanced mix across growth bands.
Strategic implications for market planning
If you want the practical “so what” for Spain, three things stand out:
- Treat white-label checkout as a growth surface
With most retailers hiding carrier brands, increasing visibility isn’t just marketing - it’s product, partnerships, and integration strategy. - OOH is still early, and it will reshape the economics
Spain’s home-dominant delivery mix is not a fixed state. As locker and parcel shop networks densify, both carrier cost-to-serve and retailer checkout strategy will shift. - Benchmark portfolios, not just presence
Provider footprints differ by retailer size, category exposure, and growth outlook. If you’re not tracking that mix, you’ll misread where your future parcel volume will come from.
Conclusion
Spain’s last-mile market is large, competitive, and still structurally under-optimised in checkout. Correos dominates branded presence and first-position frequency, white-label checkouts hide a big part of the market, and OOH remains a clear runway - with meaningful differences in portfolio quality and growth potential across providers.
Download the full Spain report, or schedule a Tembi demo to see your competitive landscape updated continuously across markets - including comparisons to our Italy analysis
Italy counts 94,724 online retailers, with clothing, groceries and beauty leading the mix, average home delivery cost at €6.5 and OOH at €5.8. With continued investment and InPost’s strong market entry, OOH delivery is expanding rapidly and reshaping the competitive landscape. This Italian last-mile delivery market analysis maps the structure, methods and provider portfolios behind the numbers.
Working in last-mile delivery and interested in another competitive market analysis beyond Italy? Let's connect. Download the full report here.
Italian last-mile delivery market analysis
Italy remains one of Europe’s most active e-commerce markets by merchant count and parcel flow. To help last-mile executives benchmark strategy, this report profiles the market composition, delivery method availability and pricing, and the competitive landscape across six core providers: GLS, Poste Italiane, DPD BRT, DHL, InPost, and FedEx (TNT). You’ll see where demand concentrates by category, how pricing positions each method, and how provider client portfolios skew by retailer size and expected growth.
All figures are derived from Tembi’s continuous monitoring and analysis of Italian online retailers and checkout setups, with consistent taxonomy and normalisation to support like-for-like comparisons. Use it to maintain competitive advantage, capture share in attractive segments, and understand market dynamics with clarity.
Quick takeaways
- Market scale: 94,724 active online retailers with an expected CAGR of 4,5%.
- Method economics: Average home delivery (non-express) €6.5 vs OOH €5.8; OOH grows, but still underrepresnted.
- Competitive mix: GLS and Poste Italiane show the broadest share of presence; first-position frequency is led by GLS, followed by DPD BRT and Poste Italiane.
- White-label checkout: over 50% of retailers don't provide delivery choice by brand, just method.
Market overview: size, growth & drivers
Italy’s 94,724-strong retailer base skews to clothes & shoes (≈12.1%), then food & groceries (≈6.7%), and beauty (≈5.4%). The size pyramid shows most merchants are medium, fewer large, and about 1% very large, indicating a wide long-tail with concentrated head accounts that influence parcel mix and service expectations. The latest available data from 2020 suggest that around 830 million parcels are shipped domestically each year. Given the latest e-commerce growth estimation of an average annual growth rate of 4.5%, parcel volumes could now be approaching one billion shipments.
Delivery provider landscape: who dominates?
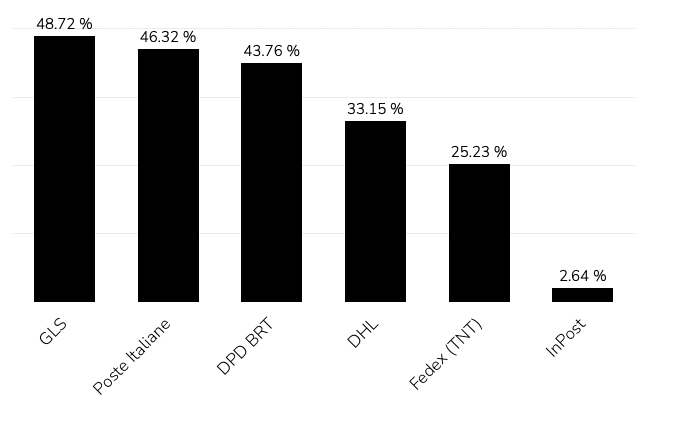
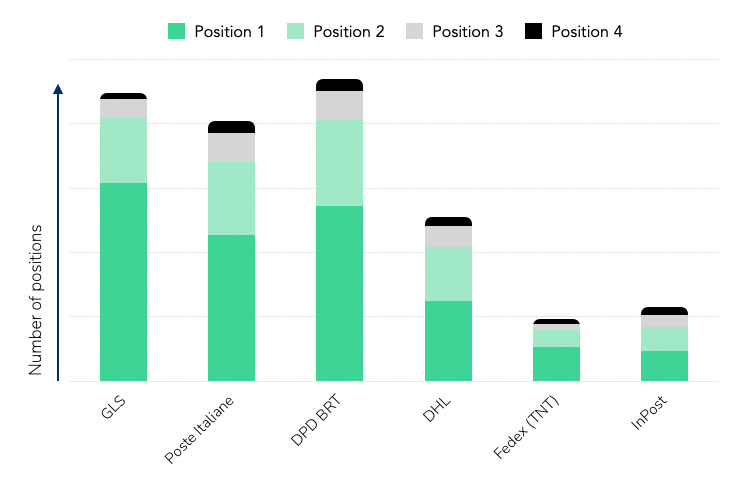
GLS and Poste Italiane hold the broadest presence across Italian webshops - GLS appears in 48.7% of retailer checkouts and Poste Italiane in 46.3%. DPD BRT, DHL, InPost, and FedEx (TNT) follow, forming the rest of the competitive landscape.
When looking at the first delivery option offered to shoppers, GLS leads with roughly 30%, followed by DPD BRT (26%) and Poste Italiane (22%).This ordering pattern reflects how retailers prioritise providers based on network reach, reliability, and negotiated terms rather than pure visibility.

In short:
- GLS commands the widest network and often the top checkout position.
- Poste Italiane mirrors that reach with strong national coverage.
- DPD BRT competes closely in second- and third-position slots, supported by regional partnerships.
- InPost and DHL show smaller overall shares but specialise in lockers and express shipments respectively.
Delivery methods: consumer options and OOH uptake
Across Italian retailers, home delivery remains dominant, offered by roughly 89% of webshops. Parcel shops (≈9%) and parcel lockers (≈3%) are still at an early stage of rollout, but both formats are expanding as networks and integrations mature.
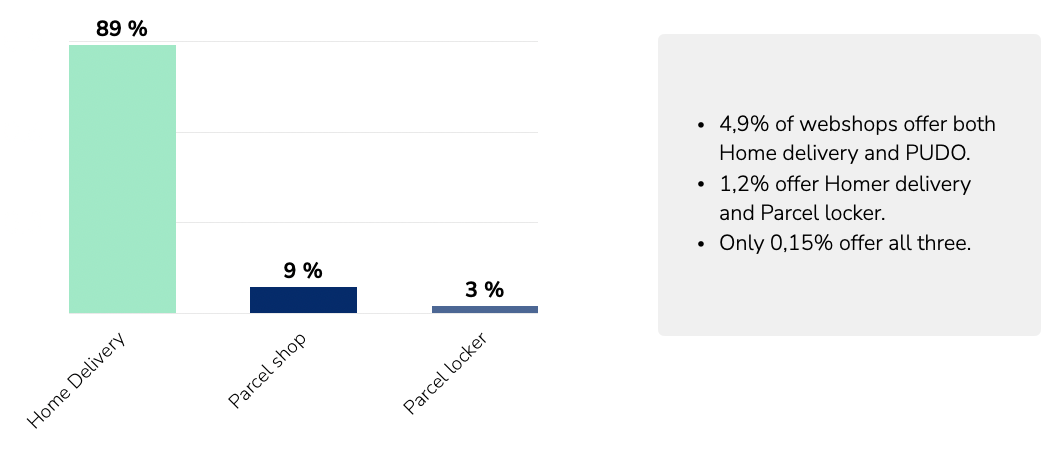

The limited share of OOH options reflects the market’s current infrastructure capacity rather than consumer demand alone. With continued investment from providers such as InPost, Poste Italiane, and DPD BRT, OOH coverage is expected to increase steadily over the next few years, giving retailers broader flexibility in how they structure delivery choices and costs.
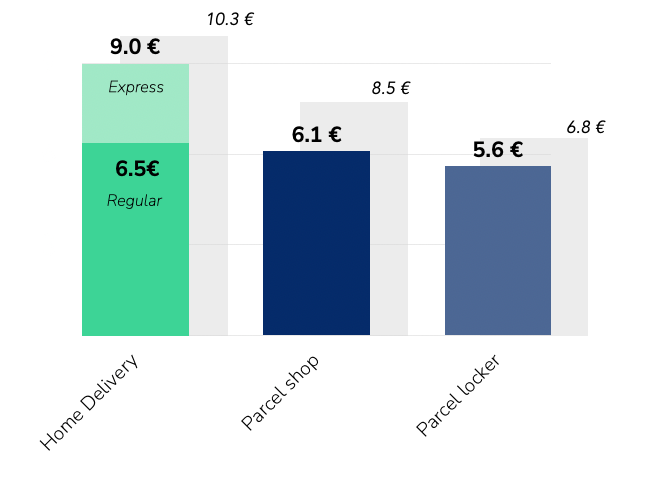
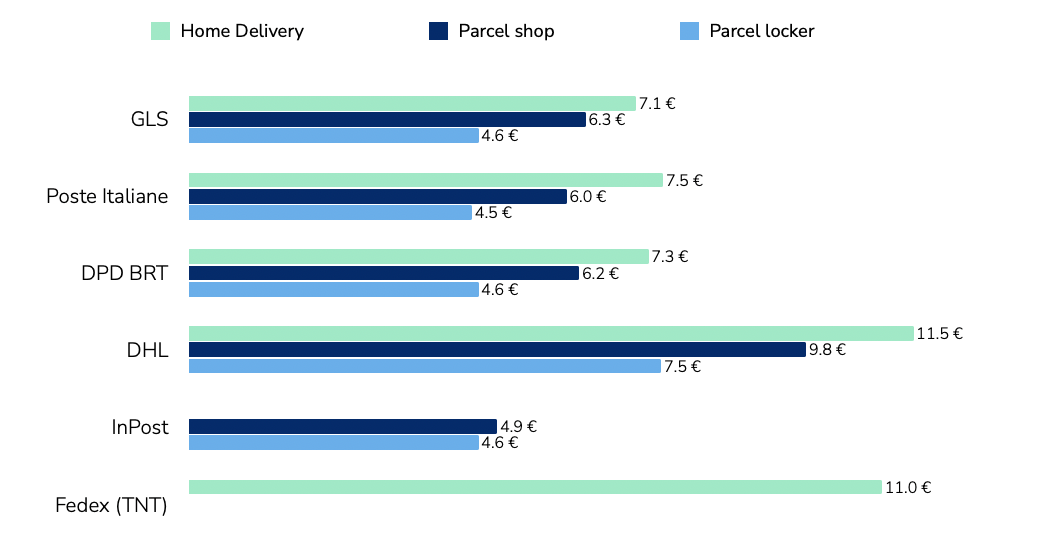
Pricing patterns by method and provider
Pricing across delivery methods follows a clear hierarchy. Home delivery is the most expensive, with DHL and FedEx (TNT) positioned at the higher end in line with their express and international focus.GLS, Poste Italiane, and DPD BRT sit around the market average, reflecting large-scale domestic coverage and standardised pricing structures. InPost maintains the lowest price levels across OOH deliveries, consistent with its parcel-locker model and high network density.
The pricing gap between home and OOH - €6.5 vs €5.8 on average - highlights the economic rationale for providers to keep expanding out-of-home capacity, and in line with most other markets. As networks grow denser, these price differences will continue to influence retailer delivery mix.
Provider portfolios: size mix, categories and growth potential
Tembi’s analysis segments retailer clients by size and growth outlook, showing how each provider’s portfolio is positioned across the Italian market.
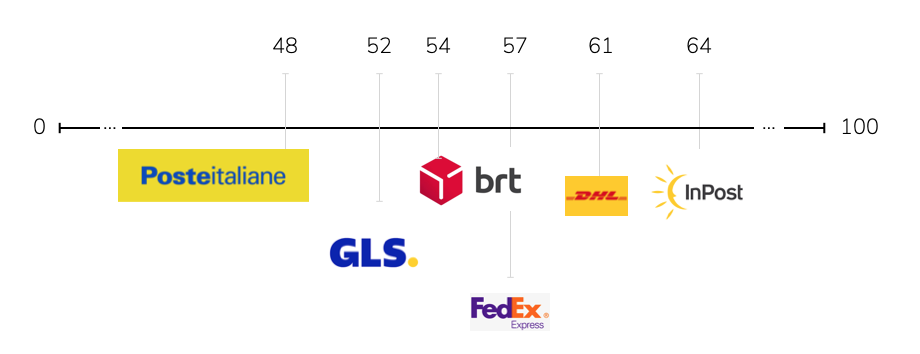
This chart summarises the average retailer size of each provider’s client base on Tembi’s 0–100 scale, where higher scores represent larger and more established webshops.
- Poste Italiane (48) and GLS (52) sit closest to the market average, reflecting broad SMB and national coverage.
- DPD BRT (54) leans slightly higher, showing stronger ties with mid-sized merchants.
- DHL (57), FedEx (61), and InPost (64) serve larger retailers on average - a clear indicator of focus on high-volume or cross-border accounts.
Together, these values illustrate the spectrum from volume-driven national carriers to enterprise-oriented networks.

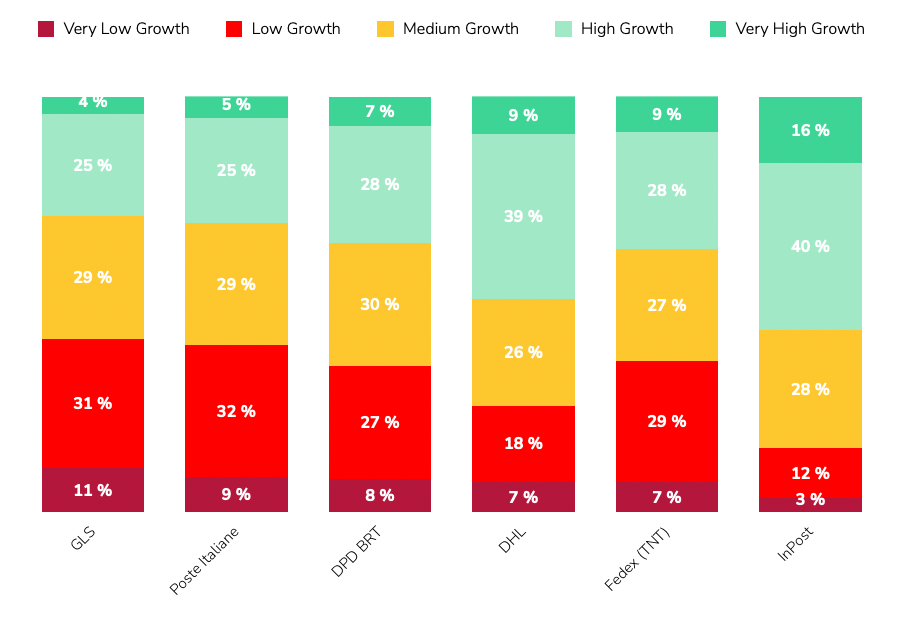
The stacked bars show how each delivery provider’s clients are distributed by retailer size:
- GLS and Poste Italiane have the broadest spread, with roughly two-thirds of their base in small or medium segments.
- DPD BRT follows a similar pattern but with a slightly larger share of large retailers.
- DHL, FedEx (TNT), and InPost have more concentrated portfolios: over half of their clients are categorised as large, and the very large segment grows from 2% for DHL to 4% for InPost.
This pattern shows a clear divide between carriers anchored in national SMB volume and those positioned around larger enterprise webshops.
Client portfolio growth potential
Using Tembi’s forward-looking Growth Indicator - a composite of product portfolio development, traffic momentum, financial proxies, and export activity - InPost has the highest share of high- and very-high-growth retailers, reflecting its alignment with fast-scaling digital merchants. DHL also skews towards higher-growth segments, supported by its express and cross-border strengths. Meanwhile, GLS, Poste Italiane, and DPD BRT hold proportionally larger bases of mature retailers, providing stability and recurring parcel volume.
OOH infrastructure: the locker and parcel shop build-out
Locker and parcel shop networks are entering a phase of rapid expansion across Italy.InPost leads with more than 3,000 lockers installed at the start of 2025. DHL and Poste Italiane jointly reported around 500 lockers by mid-2025, alongside an ambitious plan to reach 10,000 units in the coming years. DPD BRT, through its Fermopoint network, aims for up to 4,000 lockers within five years, while GLS initiated its own rollout during 2025.
This coordinated investment places Italy on a clear multi-year OOH growth trajectory, reshaping how carriers balance cost, capacity, and customer reach. The build-out is not just a convenience upgrade; it’s a structural shift in network economics - each new locker or parcel shop reduces last-mile cost per parcel and expands delivery capacity in urban areas.
Why it matters
Rising locker and parcel shop density directly influences:
- how retailers configure delivery options in checkout,
- how carriers manage peaks and failed deliveries, and
- how overall OOH adoption evolves in response to cost differentials - currently €6.5 home vs €5.8 OOH on average.
As the network matures, OOH will become a central component of Italy’s last-mile infrastructure, shaping both consumer choice and carrier efficiency.
Strategic implications for market planning
Tembi’s analysis highlights three practical dimensions that matter for market strategy and portfolio alignment.
1. Segment by retailer size and category
Italy’s retailer landscape is dominated by small and medium merchants, but larger and premium-category retailers - such as fashion, beauty, and consumer electronics - set higher expectations for service speed, reliability, and returns. Delivery providers should align SLAs, OOH coverage, and returns management to match those standards while maintaining efficient access to the long tail.
2. Model the price–mix effect
With home delivery averaging €6.5 and OOH €5.8, even a modest shift in checkout mix can materially improve cost-to-serve for both carriers and retailers. Tracking these dynamics by category and region helps identify where OOH incentives or dynamic checkout sequencing can achieve measurable margin impact.
3. Track portfolio momentum
Provider client portfolios differ in growth exposure. InPost and DHL are more concentrated among high-growth retailers, while GLS, Poste Italiane, and DPD BRT anchor the market’s stable core. Monitoring these shifts over time helps providers balance predictable SMB volume with faster-growing digital retailers, ensuring coverage across both maturity extremes.
Conclusion
Italy’s last-mile market is broad, price-competitive, and evolving. Method economics continue to favour OOH expansion as networks densify; provider portfolios show divergent exposures across retailer size and growth; and the locker build-out marks a long-term structural transformation rather than a short-term initiative.
This Italian last-mile delivery market analysis outlines the market map and comparative signals needed to inform planning, benchmarking, and partnership strategies across the sector.
Download the full Italian market report or schedule a Tembi demo to see your competitive view updated continuously.
Italy counts 94,724 online retailers, with clothing, groceries and beauty leading the mix, average home delivery cost at €6.5 and OOH at €5.8. With continued investment and InPost’s strong market entry, OOH delivery is expanding rapidly and reshaping the competitive landscape. This Italian last-mile delivery market analysis maps the structure, methods and provider portfolios behind the numbers.
Working in last-mile delivery and interested in another competitive market analysis beyond Italy? Let's connect. Download the full report here.
Italian last-mile delivery market analysis
Italy remains one of Europe’s most active e-commerce markets by merchant count and parcel flow. To help last-mile executives benchmark strategy, this report profiles the market composition, delivery method availability and pricing, and the competitive landscape across six core providers: GLS, Poste Italiane, DPD BRT, DHL, InPost, and FedEx (TNT). You’ll see where demand concentrates by category, how pricing positions each method, and how provider client portfolios skew by retailer size and expected growth.
All figures are derived from Tembi’s continuous monitoring and analysis of Italian online retailers and checkout setups, with consistent taxonomy and normalisation to support like-for-like comparisons. Use it to maintain competitive advantage, capture share in attractive segments, and understand market dynamics with clarity.
Quick takeaways
- Market scale: 94,724 active online retailers with an expected CAGR of 4,5%.
- Method economics: Average home delivery (non-express) €6.5 vs OOH €5.8; OOH grows, but still underrepresnted.
- Competitive mix: GLS and Poste Italiane show the broadest share of presence; first-position frequency is led by GLS, followed by DPD BRT and Poste Italiane.
- White-label checkout: over 50% of retailers don't provide delivery choice by brand, just method.
Market overview: size, growth & drivers
Italy’s 94,724-strong retailer base skews to clothes & shoes (≈12.1%), then food & groceries (≈6.7%), and beauty (≈5.4%). The size pyramid shows most merchants are medium, fewer large, and about 1% very large, indicating a wide long-tail with concentrated head accounts that influence parcel mix and service expectations. The latest available data from 2020 suggest that around 830 million parcels are shipped domestically each year. Given the latest e-commerce growth estimation of an average annual growth rate of 4.5%, parcel volumes could now be approaching one billion shipments.
Delivery provider landscape: who dominates?
GLS and Poste Italiane hold the broadest presence across Italian webshops - GLS appears in 48.7% of retailer checkouts and Poste Italiane in 46.3%. DPD BRT, DHL, InPost, and FedEx (TNT) follow, forming the rest of the competitive landscape.
When looking at the first delivery option offered to shoppers, GLS leads with roughly 30%, followed by DPD BRT (26%) and Poste Italiane (22%).This ordering pattern reflects how retailers prioritise providers based on network reach, reliability, and negotiated terms rather than pure visibility.
In short:
- GLS commands the widest network and often the top checkout position.
- Poste Italiane mirrors that reach with strong national coverage.
- DPD BRT competes closely in second- and third-position slots, supported by regional partnerships.
- InPost and DHL show smaller overall shares but specialise in lockers and express shipments respectively.
Delivery methods: consumer options and OOH uptake
Across Italian retailers, home delivery remains dominant, offered by roughly 89% of webshops. Parcel shops (≈9%) and parcel lockers (≈3%) are still at an early stage of rollout, but both formats are expanding as networks and integrations mature.
The limited share of OOH options reflects the market’s current infrastructure capacity rather than consumer demand alone. With continued investment from providers such as InPost, Poste Italiane, and DPD BRT, OOH coverage is expected to increase steadily over the next few years, giving retailers broader flexibility in how they structure delivery choices and costs.
Pricing patterns by method and provider
Pricing across delivery methods follows a clear hierarchy. Home delivery is the most expensive, with DHL and FedEx (TNT) positioned at the higher end in line with their express and international focus.GLS, Poste Italiane, and DPD BRT sit around the market average, reflecting large-scale domestic coverage and standardised pricing structures. InPost maintains the lowest price levels across OOH deliveries, consistent with its parcel-locker model and high network density.
The pricing gap between home and OOH - €6.5 vs €5.8 on average - highlights the economic rationale for providers to keep expanding out-of-home capacity, and in line with most other markets. As networks grow denser, these price differences will continue to influence retailer delivery mix.
Provider portfolios: size mix, categories and growth potential
Tembi’s analysis segments retailer clients by size and growth outlook, showing how each provider’s portfolio is positioned across the Italian market.
This chart summarises the average retailer size of each provider’s client base on Tembi’s 0–100 scale, where higher scores represent larger and more established webshops.
- Poste Italiane (48) and GLS (52) sit closest to the market average, reflecting broad SMB and national coverage.
- DPD BRT (54) leans slightly higher, showing stronger ties with mid-sized merchants.
- DHL (57), FedEx (61), and InPost (64) serve larger retailers on average - a clear indicator of focus on high-volume or cross-border accounts.
Together, these values illustrate the spectrum from volume-driven national carriers to enterprise-oriented networks.
The stacked bars show how each delivery provider’s clients are distributed by retailer size:
- GLS and Poste Italiane have the broadest spread, with roughly two-thirds of their base in small or medium segments.
- DPD BRT follows a similar pattern but with a slightly larger share of large retailers.
- DHL, FedEx (TNT), and InPost have more concentrated portfolios: over half of their clients are categorised as large, and the very large segment grows from 2% for DHL to 4% for InPost.
This pattern shows a clear divide between carriers anchored in national SMB volume and those positioned around larger enterprise webshops.
Client portfolio growth potential
Using Tembi’s forward-looking Growth Indicator - a composite of product portfolio development, traffic momentum, financial proxies, and export activity - InPost has the highest share of high- and very-high-growth retailers, reflecting its alignment with fast-scaling digital merchants. DHL also skews towards higher-growth segments, supported by its express and cross-border strengths. Meanwhile, GLS, Poste Italiane, and DPD BRT hold proportionally larger bases of mature retailers, providing stability and recurring parcel volume.
OOH infrastructure: the locker and parcel shop build-out
Locker and parcel shop networks are entering a phase of rapid expansion across Italy.InPost leads with more than 3,000 lockers installed at the start of 2025. DHL and Poste Italiane jointly reported around 500 lockers by mid-2025, alongside an ambitious plan to reach 10,000 units in the coming years. DPD BRT, through its Fermopoint network, aims for up to 4,000 lockers within five years, while GLS initiated its own rollout during 2025.
This coordinated investment places Italy on a clear multi-year OOH growth trajectory, reshaping how carriers balance cost, capacity, and customer reach. The build-out is not just a convenience upgrade; it’s a structural shift in network economics - each new locker or parcel shop reduces last-mile cost per parcel and expands delivery capacity in urban areas.
Why it matters
Rising locker and parcel shop density directly influences:
- how retailers configure delivery options in checkout,
- how carriers manage peaks and failed deliveries, and
- how overall OOH adoption evolves in response to cost differentials - currently €6.5 home vs €5.8 OOH on average.
As the network matures, OOH will become a central component of Italy’s last-mile infrastructure, shaping both consumer choice and carrier efficiency.
Strategic implications for market planning
Tembi’s analysis highlights three practical dimensions that matter for market strategy and portfolio alignment.
1. Segment by retailer size and category
Italy’s retailer landscape is dominated by small and medium merchants, but larger and premium-category retailers - such as fashion, beauty, and consumer electronics - set higher expectations for service speed, reliability, and returns. Delivery providers should align SLAs, OOH coverage, and returns management to match those standards while maintaining efficient access to the long tail.
2. Model the price–mix effect
With home delivery averaging €6.5 and OOH €5.8, even a modest shift in checkout mix can materially improve cost-to-serve for both carriers and retailers. Tracking these dynamics by category and region helps identify where OOH incentives or dynamic checkout sequencing can achieve measurable margin impact.
3. Track portfolio momentum
Provider client portfolios differ in growth exposure. InPost and DHL are more concentrated among high-growth retailers, while GLS, Poste Italiane, and DPD BRT anchor the market’s stable core. Monitoring these shifts over time helps providers balance predictable SMB volume with faster-growing digital retailers, ensuring coverage across both maturity extremes.
Conclusion
Italy’s last-mile market is broad, price-competitive, and evolving. Method economics continue to favour OOH expansion as networks densify; provider portfolios show divergent exposures across retailer size and growth; and the locker build-out marks a long-term structural transformation rather than a short-term initiative.
This Italian last-mile delivery market analysis outlines the market map and comparative signals needed to inform planning, benchmarking, and partnership strategies across the sector.
Download the full Italian market report or schedule a Tembi demo to see your competitive view updated continuously.
For most companies, two questions matter when looking at the e-commerce market: which webshops will grow and how large they are today. These are not easy to answer. Financial accounts are published once a year and often with long delays. Website traffic tools vary in accuracy. Sales input can be useful, but it is not consistent across markets.
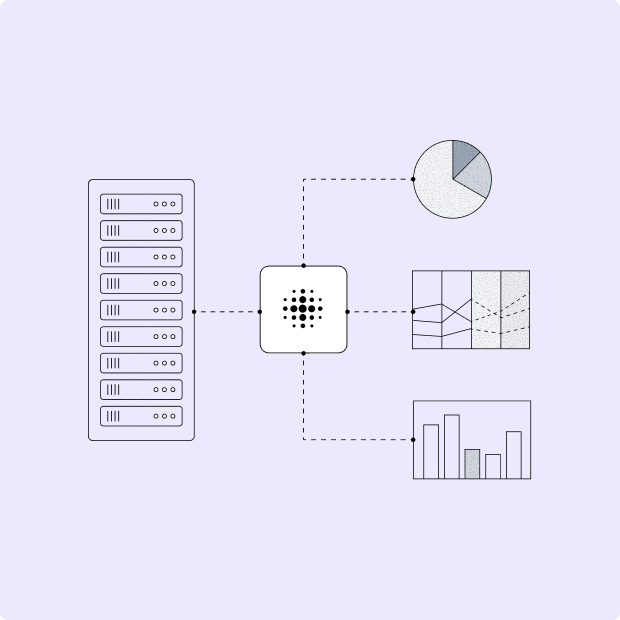
Tembi approaches the problem differently. We track over 800.000 webshops in 22 European markets, visiting them every two weeks, and we convert that activity into a clear view of current size and likely growth.
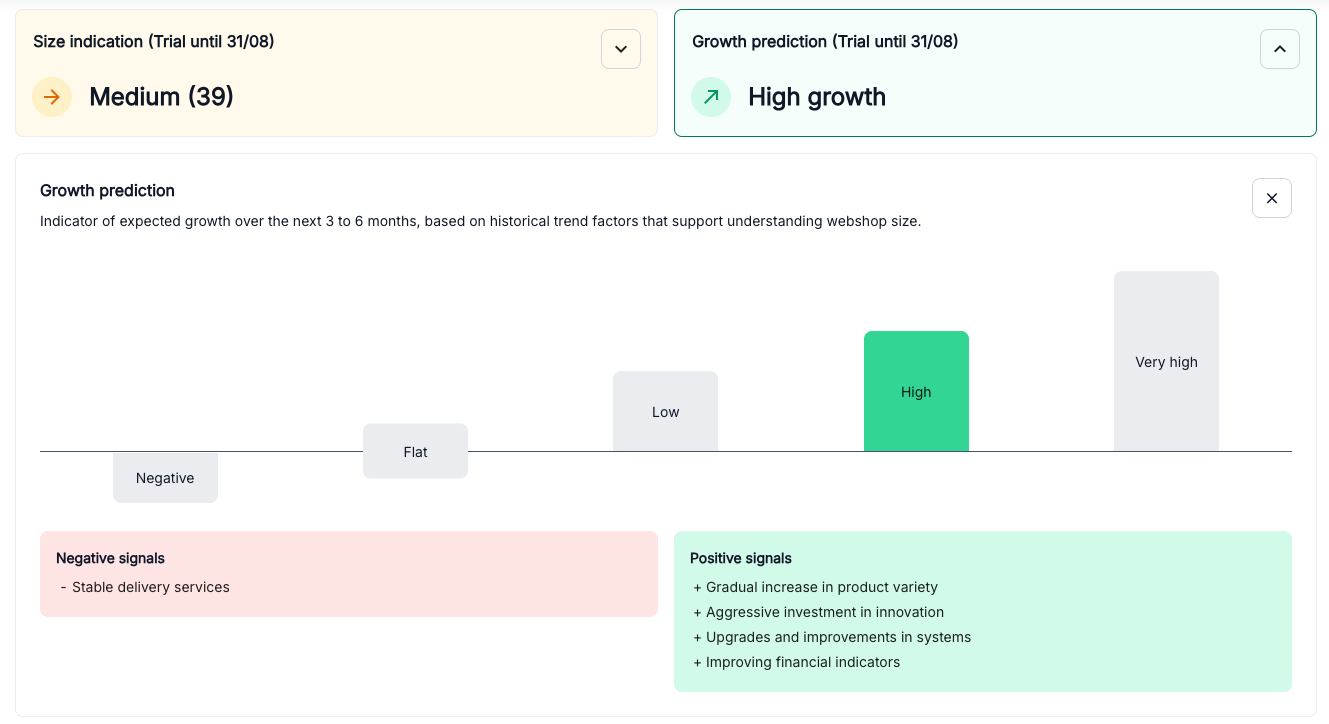
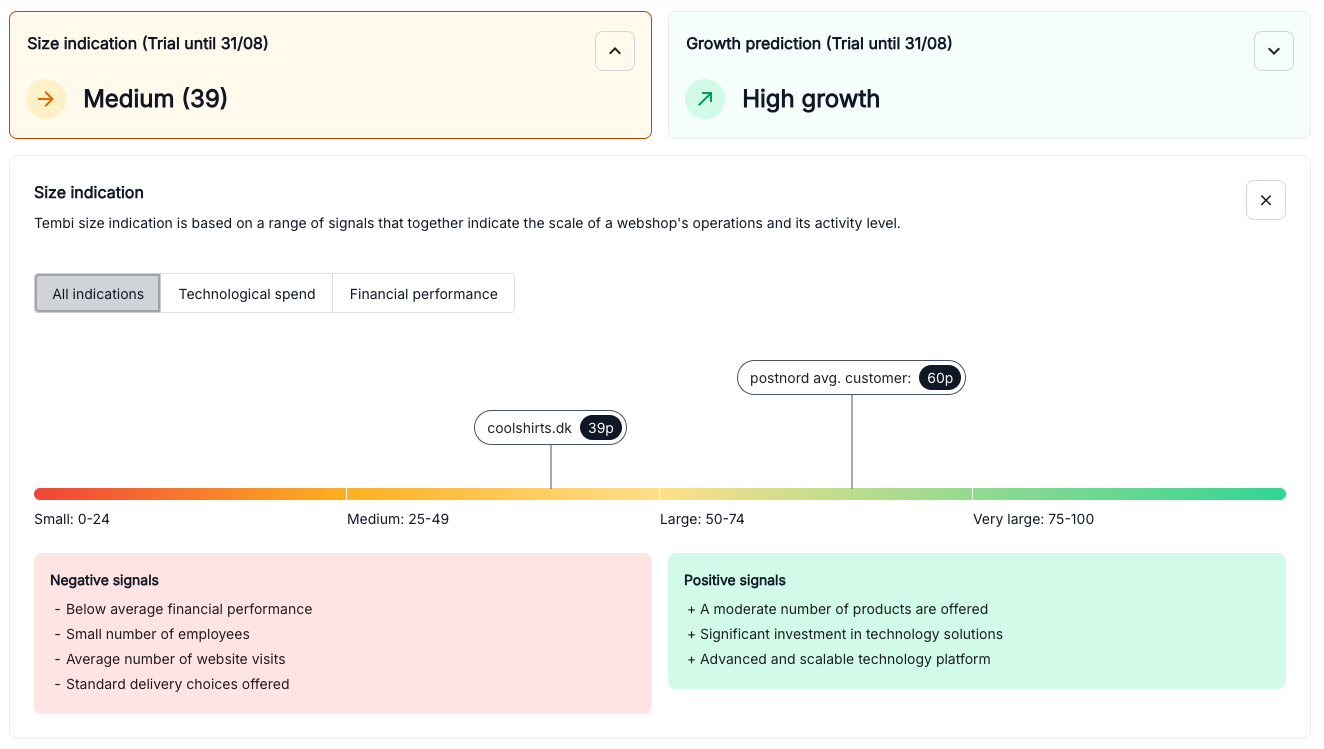
What the outputs are
From this data, we produce two measures.
- The size score (size estimation) shows how large a webshop is relative to others in the same market. It runs on a 0–100 scale and is built from multiple operating signals, not just a single proxy like traffic or revenue.
- The growth outlook (Growht prediction) indicates whether a webshop is likely to expand, remain stable, or decline in the months ahead. We classify this into five levels: Negative, Flat, Low, High and Very High.
Together, these outputs give a comparable and timely view of the market that has not been available before.
The data behind the model
What makes this possible is the breadth of signals we collect. Every webshop is assessed on seven main areas:
- Export markets – selling into multiple countries is strongly linked to scale and resilience.
- Delivery setup – the number and type of carriers and methods say a lot about maturity.
- Technical add-ons – tools for reviews, marketing, or experimentation signal investment.
- Infrastructure – the platform and payment systems in use, from lightweight to enterprise.
- Financials and employees – a valuable anchor when available, though not the only input.
- Traffic – used carefully as a directional trend.
- Products – the number of SKUs, their development over time, and their categories.
It is the combination of these factors, updated every two weeks, that produces a reliable picture of both size and growth.
Why this matters
Older approaches depend on delayed filings, unstable traffic estimates, or anecdotal sales input. They describe the past, not the present. By contrast, Tembi provides a structured, repeatable model that updates with the market itself. A Danish fashion webshop and a Spanish electronics retailer can be measured on the same scale, and shifts in momentum can be detected months before they appear in official reports.
What this enables
- Sales teams can prioritise accounts that are growing.
- Category managers can see which product areas are moving up or down.
- Carriers and enablers can track portfolio risk and adjust before market shifts affect revenue.
- Corporate development can identify acquisition targets with proven momentum early.
This is not prediction for prediction’s sake. It is about replacing guesswork with evidence that is current, structured and comparable.
Tembi provides a way to see the market as it develops — which webshops are growing, how large they are, and where categories are shifting. It offers the clarity needed to make decisions with confidence, based on how the market is moving today.
See it in action
Growth predictions and Size estimation are available on all markets Tembi has been active on for more then three months.
For most companies, two questions matter when looking at the e-commerce market: which webshops will grow and how large they are today. These are not easy to answer. Financial accounts are published once a year and often with long delays. Website traffic tools vary in accuracy. Sales input can be useful, but it is not consistent across markets.
Tembi approaches the problem differently. We track over 800.000 webshops in 22 European markets, visiting them every two weeks, and we convert that activity into a clear view of current size and likely growth.
What the outputs are
From this data, we produce two measures.
- The size score (size estimation) shows how large a webshop is relative to others in the same market. It runs on a 0–100 scale and is built from multiple operating signals, not just a single proxy like traffic or revenue.
- The growth outlook (Growht prediction) indicates whether a webshop is likely to expand, remain stable, or decline in the months ahead. We classify this into five levels: Negative, Flat, Low, High and Very High.
Together, these outputs give a comparable and timely view of the market that has not been available before.
The data behind the model
What makes this possible is the breadth of signals we collect. Every webshop is assessed on seven main areas:
- Export markets – selling into multiple countries is strongly linked to scale and resilience.
- Delivery setup – the number and type of carriers and methods say a lot about maturity.
- Technical add-ons – tools for reviews, marketing, or experimentation signal investment.
- Infrastructure – the platform and payment systems in use, from lightweight to enterprise.
- Financials and employees – a valuable anchor when available, though not the only input.
- Traffic – used carefully as a directional trend.
- Products – the number of SKUs, their development over time, and their categories.
It is the combination of these factors, updated every two weeks, that produces a reliable picture of both size and growth.
Why this matters
Older approaches depend on delayed filings, unstable traffic estimates, or anecdotal sales input. They describe the past, not the present. By contrast, Tembi provides a structured, repeatable model that updates with the market itself. A Danish fashion webshop and a Spanish electronics retailer can be measured on the same scale, and shifts in momentum can be detected months before they appear in official reports.
What this enables
- Sales teams can prioritise accounts that are growing.
- Category managers can see which product areas are moving up or down.
- Carriers and enablers can track portfolio risk and adjust before market shifts affect revenue.
- Corporate development can identify acquisition targets with proven momentum early.
This is not prediction for prediction’s sake. It is about replacing guesswork with evidence that is current, structured and comparable.
Tembi provides a way to see the market as it develops — which webshops are growing, how large they are, and where categories are shifting. It offers the clarity needed to make decisions with confidence, based on how the market is moving today.
See it in action
Growth predictions and Size estimation are available on all markets Tembi has been active on for more then three months.
The retail industry is in the midst of profound transformation driven by two interconnected forces: the convergence of retail and e-commerce into a hybrid landscape, and the rapid integration of Artificial Intelligence (AI). These forces aren't just altering shopping habits - they're reshaping the entire retail value chain from manufacturing to fulfilment. McKinsey identifies these as key economic game-changers (putting aside broader geopolitical factors).
Two forces reshaping retail
1. The blended future of e-commerce and retail
E-commerce has evolved beyond a simple digital channel into three overlapping segments:
• Manufacturers going Direct-to-Consumer (DTC): Brands like Nike, Zara, and Dyson build direct customer relationships through digital storefronts and direct shipments.
• Pure-Play digital platforms: Born-digital platforms like Zalando and ASOS innovate with personalisation and logistics, with some even branching into physical flagship stores.
• Traditional retailers adopting digital: Giants like IKEA and Walmart are integrating physical and digital experiences seamlessly.
These segments are merging into a highly competitive ecosystem where agility and market intelligence are essential. This blending doesn't simplify competition - it intensifies it, demanding constant vigilance and adaptability.
2. AI-driven retail intelligence
AI has moved from futuristic concept to operational necessity. Retailers leverage AI for personalised recommendations, dynamic pricing, predictive inventory management, and customer service automation, enabling smarter, faster, and more profitable operations.
Additionally, the expansion of cloud computing and the explosion of available data provide new opportunities to understand market dynamics in real-time. Historically, analysing every shelf in Europe was unthinkable; today, online data combined with AI makes large-scale, real-time market analysis entirely feasible.
A strategic framework for AI-enabled retail
Staying ahead requires a structured approach. Recently, Shish Shridhar from our partner Microsoft shared a strategic framework leveraging real-time data, AI, and automation, highlighting essential levers to drive growth.
Customer-facing levers
Place – Sales channels: physical, digital, hybrid
Product – Assortment depth, availability
Value – Pricing strategy, perceived customer value
People – Customer service, store experience
Communication – Marketing, promotions, loyalty programmes
Operational levers ("The Triangle")
Systems – Technology infrastructure, analytics, automation
Logistics – Efficient supply chain, fulfilment methods, delivery
Suppliers – Vendor management, sourcing and COGS
How market intelligence creates a competitive advantage
At Tembi, we equip retailers and brands with large-scale market analytics derived from real-time data. We continuously track over 600,000 online retailers and 300 million products across Europe - among the largest datasets in the industry. By connecting this data with location specifics, company details, and AI-powered analytics, commercial teams gain clarity and confidence in decision-making, eliminating guesswork when it comes to understanding what drives growth.
As I see it, by unifying data across digital and physical touch points, market intelligence at scale enables smarter decisions in Product, Value, and Systems - helping businesses thrive in a hybrid, AI-first retail world.
Place
• Based on the product categories that you excel in - which markets are then optimal, and in which geographies would it be optimal to promote and sell your products.
• If you have or plan to set up physical stores how are they threatened and compared to online retailers, and how is the specific area you think about investing in evolving. This will show whether you can expect optimal levels for sales per store and store traffic.
Product
• Predict which product categories and brands to invest in, when you decide where to play - which product segments are you in with which brand and pricing strategies to drive market share and inventory turnover and hence sales growth.
• Understand the competition in the product categories and brands you are in and the strengths and strategies of the other players in the market.
Improve out-of stock-rate by finding out when products are sold over the year and if that differs in different geographies, and thereby make sure that availability is secured.
Value
• Understand the current (or seasonality-defined) pricing in the market to increase gross margin, right-in-time markdowns, and possibility for price skimming but get an actual X-ray about the real price development in the market.
Logistics
• When being present in the market, or especially entering a new one, you need to know how to make it successful. One of the important things to understand delivery market standards in different markets, e.g. OOH, home delivery, free shipping thresholds, delivery time etc. Some D2C try to negotiate a pan-European delivery contract without factoring ion the different market dynamics, or simply enter with the wrong expectations. This quickly becomes very expensive - e.g. if the customers are used to home deliveries and you go in the market wth parcel boxes, you would need to wait for that to be changed. Hence, very important to understand if you model fits to assure fulfilment accuracy.
Intelligence as the new retail imperative
Success in modern retail isn’t about choosing between physical and digital - it’s about blending them intelligently. In the era defined by AI and hybrid commerce, tools like Tembi provide retailers the crucial insights required to navigate complexity.
Whether you’re a DTC manufacturer, a digital-first retailer expanding your reach, or a traditional retailer enhancing your omnichannel strategy, winning demands strategic clarity grounded in data and real-time market intelligence.


.png)


