


Our recent analysis of aggregated data from webshops in selected European countries confirms two straightforward insights about cross-border selling: webshops typically target neighbouring countries or seek out larger markets to grow their potential customer base. While these findings may seem intuitive, the data illustrates clearly how consistently webshops employ these strategies - particularly when supported by strong partnerships with local logistics providers and prioritised investments in localisation.

The obvious role of proximity
Webshops in Denmark primarily target Sweden (18.9%) and Germany (18%), reflecting straightforward cross-border logistics and cultural familiarity. Similarly, Dutch webshops predominantly sell to Belgium (17.4%) and Germany (13.5%), confirming that short distances and established regional logistics make neighbouring countries natural first choices. Swedish webshops follow the same logic, favouring close neighbours Denmark (17.2%) and Finland (15.9%).
Targeting larger markets beyond proximity
Webshops strategically pursue larger markets with robust consumer bases, such as Germany and France, regardless of direct proximity. For instance, Italian webshops commonly sell to Germany (14.2%) and France (14.1%), driven significantly by the size and high purchasing power of these markets, alongside geographical closeness.
Distinctive patterns in Eastern Europe
Webshops in Hungary display notably low cross-border priority: only 4.4% offer shipping options to Germany, Slovakia, and Romania. This cautious approach likely reflects specific economic calculations, infrastructural limitations, or less developed cross-border logistics partnerships, rather than purely geographical factors.
Latvian webshops clearly illustrate the proximity factor again, heavily targeting neighbouring Lithuania (16.8%) and Estonia (15.9%), highlighting ease of trade through geographic and cultural closeness.
Notable differences in cross-border engagement levels
A significant finding from the data is the variation in how actively webshops pursue international markets. Factors driving these differences include the maturity of the domestic e-commerce market, logistical infrastructure, consumer purchasing power, and particularly the level of investment into localisation and logistics solutions. Engagement levels notably decline with increasing distance, indicating logistical complexity and higher costs likely deter webshops from extensive international expansion beyond neighbouring or well-established larger markets.
Concluding remarks
Our aggregated data confirms proximity and market size as primary drivers for cross-border e-commerce decisions. However, the diverse patterns and varying engagement levels suggest that webshop decisions are influenced by more complex strategic factors, including infrastructural readiness, economic conditions, logistical capabilities, and the willingness to invest in localised consumer experiences. These factors ultimately shape cross-border success far more than geographical closeness alone.
More from
E-commerce
category


Delivery pricing trends ahead of Q4 2025
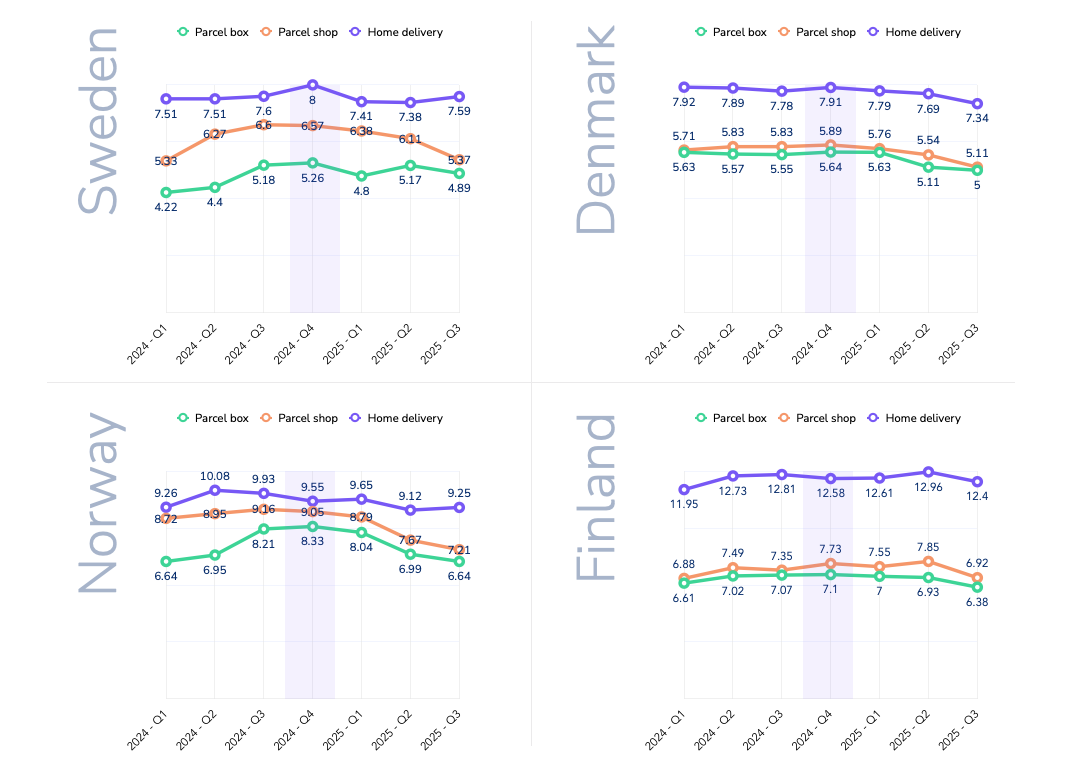
Delivery fees across the Nordics have followed clear seasonal patterns and strategic adjustments over the past two years. Drawing on data from over100,000 webshops in Sweden, Denmark, Finland, and Norway between Q1 2024 and Q32025, we track how average consumer delivery prices (in EUR) have shifted.
This analysis zooms in on the Q4 holiday peak, highlights country-specific behaviours, and compares delivery methods in urban areas - parcel lockers, pickup points, and home delivery. The aim is to show how webshops shape their pricing strategies and how these evolve through the year.

Seasonal pricing patterns and Q4 fluctuations
Seasonality is a defining feature of delivery pricing in the Nordics. Q4, the peak holiday quarter, typically brings stable or higher fees rather than discounts. In late 2024, Black Friday and Christmas did not lead to cheaper delivery - instead, many webshops kept prices firm or lifted them slightly.
· Sweden: average home delivery rose from €7.60 in Q3 2024 to €8.00 in Q4, the annual peak.
· Denmark: small increases, such as parcel shop delivery at €5.89 in Q4 versus €5.83 inQ3.
· Finland: parcel shop fees jumped by around 5% in Q4 2024.
· Norway: parcel box delivery peaked during the holiday quarter.
The pattern suggests that in high-demand Q4, retailers prioritise covering fulfilment costs over cutting fees - even when running heavy sales campaigns.
This shifts in Q1, when prices correct downward. After the holiday rush, many webshops reduced or normalised fees:
- In Sweden, parcel box delivery fell from €5.26 in Q4 to €4.80 in Q1 2025.
- In Denmark, the small Q4 upticks were rolled back early in 2025.
- Norway saw a short-lived rise in home delivery(from €9.55 to €9.65 in Q1) before prices dropped sharply in Q2.
This Q1 softness reflects the post-holiday slowdown in demand and renewed competition to attract consumers during a quieter season.
Q4 2024 stands out as a high point for delivery fees in several markets, corroborating that peak season surcharges and fewer free-shipping promos were in effect. In fact, during Black Week (Black Friday 2024), retailers across Noridcs reduced the prevalence of free shipping by 4% compared to 2023, opting instead to set spend thresholds or promote premium paid options (source: ingrid.com). In other words, fewer orders enjoyed “free delivery” in Q4 2024, as merchants nudged customers toward paid faster delivery or order bundling.This strategic move helped protect margins during the holiday boom – and consumers generally went along, paying for delivery when the value (speed, convenience) was clear (source: ingrid.com). The seasonal insight here is that peak demand doesn’t equal cheaper shipping; if anything, many webshops use the period to upsell premium delivery or maintain prices, rather than offer blanket free shipping.
Moving through 2025, the Q2 and Q3 2025 data show an interesting reset. By summer 2025, average delivery charges in many categories fell back to or below their levels from the previous holiday season. This sets the stage for how Q4 2025 might play out – which we’ll discuss in a moment.
Country-by-Country Insights
Each Nordic market shows distinct pricing dynamics, shaped by competition, consumer behaviour, and delivery costs.
Sweden
Swedish webshops consistently post the lowest delivery fees in the region.In early 2024, prices were modest - around €4.20 for locker delivery and €7.50 for home delivery. These rose steadily through the year, with parcel box and parcel shop deliveries more than 20% higher by Q3/Q4. Home delivery peaked at €8.00 in Q42024, reflecting inflationary pressures and webshop/carriers passing higher rates on to consumers.
In 2025, the trend reversed. By Q3 2025, parcel shop delivery had dropped from €6.57 in Q4 2024 to €5.37 (an 18% decline),while home delivery eased back to €7.59. This points to intensifying competition, with Swedish retailers willing to cut delivery prices quickly to gain an edge.
Denmark
Denmark’s delivery pricing remained stable through 2024, with parcel lockers and pickup points in the mid-€5 range and home delivery around €7.80–7.90. Even in Q4, increases were marginal- for example, parcel shop delivery at €5.89 in Q4 versus €5.83 in Q3.
The shift came in 2025. By Q3, parcel lockers averaged €5.00 and parcel shops €5.11 - 10–13% lower than the prior holiday season. Home delivery also dipped to €7.30 from €7.91 in Q4 2024. This gradual decline suggests Danish webshops began competing more actively on delivery price or carriers pressed the prices further down.
Finland
Finland remains the most expensive Nordic market for delivery - especially for home delivery. In 2024, Finnish shoppers paid €12–13 for home delivery, nearly double Sweden’s average. Out-of-home methods were also high at €7+. Prices climbed steadily through 2024, with parcel shops up 12% by Q4.
In 2025, home delivery crept even higher, peaking at €12.90 in Q2. But by Q3, parcel locker and shop fees had fallen sharply - down about 10% from Q2, back to early-2024 levels. Home delivery stabilised around€12.50.
Norway
Norway experienced the most pronounced swings. In 2024, home delivery peaked at €10.08 in Q2, while parcel lockers (€8.21) and parcel shops (€9.16) hit highs in Q3. Interestingly, Q4 home delivery was lower than earlier in the year at €9.55.
By 2025, Norwegian webshops had cut prices heavily, especially for out-of-home delivery. Parcel lockers fell from over €8in late 2024 to €6.64 by Q3 2025- a 20% year-on-year drop. Parcel shop delivery followed a similar pattern, down about €1.20 on average versus Q4 2024. Home delivery also eased slightly to €9.25 by Q3.
The widening price gap between home and pickup options suggests a deliberate push to shift volume to more cost-efficient methods. For carriers, Norway highlights how quickly competitive conditions can change - and the need to adjust pricing strategies in real time.
To summarize the country trends, Table 1 highlights how delivery fees in Q3 2025 compare to the last peak season (Q42024). Most markets saw notable declines in that period, especially for out-of-home deliveries:
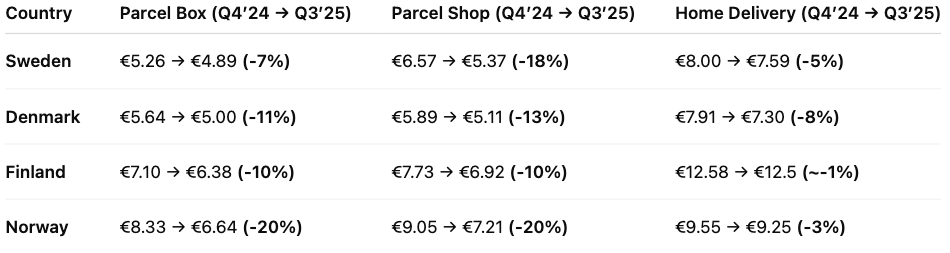
Table 1: Average delivery price in Q4 2024 vs Q3 2025, by country and delivery method. Prices fell in most categories (especially parcel box and parcel shop deliveries) as of mid-2025, compared to the last holiday season.
Delivery Method Trends: Parcel Box vs. Parcel Shop vs. Home
Data clearly shows that out-of-home delivery is significantly cheaper for consumers in urban areas – a natural effect when carriers can deliver 5–10 times more parcels per driver compared with home delivery.
Parcel box (locker) delivery
· Cheapest option across all markets by 2025(~€5–6.5).
· Prices spiked in 2024 (e.g. Norway €6.6 → €8.3)but dropped back sharply in 2025.
· Volatility suggests retailers test price sensitivity, then reset as competition kicks in.
Parcel shop(pickup point) delivery
· Typically a few cents above lockers, but fell notably in 2025.
· Norway: from ~€9 in 2024 to €7.2 by Q3 2025.
· Pricing gap with home delivery widened, creating strong incentives for consumers to choose pickup.
Home delivery
· Premium service, consistently the most expensive.
· Held steady through 2024–25: ~€7.5 in SE/DK,~€9.3 in NO, ~€12.5 in FI.
· Only small price drops, with Sweden (-13% YoY)the exception.
· Discounts remain rare and tied to high order values.
The bigger picture
Out-of-home delivery became cheaper in 2025, while home delivery kept its premium. This reflects a conscious decision: steer demand towards lockers and pickup points to cut last-mile costs and ease peak-season pressure. Black Week 2024 showed the effect in practice - locker usage rose by four percentage points and delivery times improved as shoppers embraced flexible collection (source: ingrid.com).
For logistics providers and retailers, aggressive pricing on out-of-home delivery seems to become a core lever: it nudges cost-conscious consumers, reduces operational strain, while keeping satisfaction high. But the gap has limits - home delivery still anchors convenience expectations and remains a profit lever. The real challenge is balance: keeping lockers and pickups highly attractive without eroding the value or accessibility of home delivery.
Collaboration between retailers and logistics providers is key here, ensuring service levels meet expectations as more customers choose out-of-home - seen clearly during Black Week, when lockers not only gained share but also delivered faster on average (source: ingrid.com).
Outlook forQ4 2025: What to Expect in the Peak Season
To keep the forecast transparent, we applied a simple model: for each country × delivery method, we took the Q4-over-Q3 seasonal change from 2024 and applied that ratio to Q3 2025 levels. Where 2025 trended lower than 2024, we also include a conservative midpoint between Q3 2025 and that baseline.
Regional forecast (Q4 2025)
· Parcel box(lockers): €5.6–6.0
· Parcel shop(pickup): €6.1–6.3
· Home delivery: €9.0–9.2
Seasonal lift from Q3 to Q4 looks modest. Home delivery remains the premium option, while lockers and parcel shops stay clearly cheaper.
By market
· Sweden: home ~€8.0 (flat vs last year); parcel shop ~€5.3 and lockers ~€5.0 (well below last year).
· Denmark: home ~€7.4; parcel shop ~€5.2; lockers ~€5.1 (all lower than last year).
· Finland: home ~€12.5 (still high); parcel shop ~€7.3; lockers ~€6.4 (both down year-on-year).
· Norway: home ~€9.25 (slightly below last year); parcel shop ~€7.1; lockers ~€6.7 (~20%down year-on-year).
Summary outlook for Q4 2025
Nordic delivery prices have eased through 2025 after peaking in late 2024, especially for out-of-home options (parcel box and parcel shop). Applying last year’s Q4-over-Q3 seasonality to current Q3 levels points to only small Q4 uplifts: lockers and pickups remain the low-cost choices, while home delivery stays premium and broadly flat.
Country patterns matter. Sweden and Denmark have lower 2025 bases and limited room for Q4 increases. Finland remains structurally high - especially on home delivery - so stability is more likely than hikes. Norway has corrected sharply this year, with retailers continuing to nudge volume toward cheaper lockers and pickups.
The underlying pricing strategies are clear:
· Continued shift to out-of-home delivery. Lower pricing here is deliberate - directing volume away from costly home delivery and easing last-mile strain.
· Home delivery as a premium anchor. Price cuts are modest; competition is about service quality (slots, ETAs, first-attempt success) rather than cents.
· Seasonal resets. After Christmas, prices ease in Q1—a cycle webshops use to stay competitive in slower months.
Finally, weigh this outlook against external factors that can quickly shift the picture: capacity constraints and consumer sentiment. If sentiment weakens, retailers may lean harder on thresholds and targeted incentives.
Delivery fees across the Nordics have followed clear seasonal patterns and strategic adjustments over the past two years. Drawing on data from over100,000 webshops in Sweden, Denmark, Finland, and Norway between Q1 2024 and Q32025, we track how average consumer delivery prices (in EUR) have shifted.
This analysis zooms in on the Q4 holiday peak, highlights country-specific behaviours, and compares delivery methods in urban areas - parcel lockers, pickup points, and home delivery. The aim is to show how webshops shape their pricing strategies and how these evolve through the year.
Seasonal pricing patterns and Q4 fluctuations
Seasonality is a defining feature of delivery pricing in the Nordics. Q4, the peak holiday quarter, typically brings stable or higher fees rather than discounts. In late 2024, Black Friday and Christmas did not lead to cheaper delivery - instead, many webshops kept prices firm or lifted them slightly.
· Sweden: average home delivery rose from €7.60 in Q3 2024 to €8.00 in Q4, the annual peak.
· Denmark: small increases, such as parcel shop delivery at €5.89 in Q4 versus €5.83 inQ3.
· Finland: parcel shop fees jumped by around 5% in Q4 2024.
· Norway: parcel box delivery peaked during the holiday quarter.
The pattern suggests that in high-demand Q4, retailers prioritise covering fulfilment costs over cutting fees - even when running heavy sales campaigns.
This shifts in Q1, when prices correct downward. After the holiday rush, many webshops reduced or normalised fees:
- In Sweden, parcel box delivery fell from €5.26 in Q4 to €4.80 in Q1 2025.
- In Denmark, the small Q4 upticks were rolled back early in 2025.
- Norway saw a short-lived rise in home delivery(from €9.55 to €9.65 in Q1) before prices dropped sharply in Q2.
This Q1 softness reflects the post-holiday slowdown in demand and renewed competition to attract consumers during a quieter season.
Q4 2024 stands out as a high point for delivery fees in several markets, corroborating that peak season surcharges and fewer free-shipping promos were in effect. In fact, during Black Week (Black Friday 2024), retailers across Noridcs reduced the prevalence of free shipping by 4% compared to 2023, opting instead to set spend thresholds or promote premium paid options (source: ingrid.com). In other words, fewer orders enjoyed “free delivery” in Q4 2024, as merchants nudged customers toward paid faster delivery or order bundling.This strategic move helped protect margins during the holiday boom – and consumers generally went along, paying for delivery when the value (speed, convenience) was clear (source: ingrid.com). The seasonal insight here is that peak demand doesn’t equal cheaper shipping; if anything, many webshops use the period to upsell premium delivery or maintain prices, rather than offer blanket free shipping.
Moving through 2025, the Q2 and Q3 2025 data show an interesting reset. By summer 2025, average delivery charges in many categories fell back to or below their levels from the previous holiday season. This sets the stage for how Q4 2025 might play out – which we’ll discuss in a moment.
Country-by-Country Insights
Each Nordic market shows distinct pricing dynamics, shaped by competition, consumer behaviour, and delivery costs.
Sweden
Swedish webshops consistently post the lowest delivery fees in the region.In early 2024, prices were modest - around €4.20 for locker delivery and €7.50 for home delivery. These rose steadily through the year, with parcel box and parcel shop deliveries more than 20% higher by Q3/Q4. Home delivery peaked at €8.00 in Q42024, reflecting inflationary pressures and webshop/carriers passing higher rates on to consumers.
In 2025, the trend reversed. By Q3 2025, parcel shop delivery had dropped from €6.57 in Q4 2024 to €5.37 (an 18% decline),while home delivery eased back to €7.59. This points to intensifying competition, with Swedish retailers willing to cut delivery prices quickly to gain an edge.
Denmark
Denmark’s delivery pricing remained stable through 2024, with parcel lockers and pickup points in the mid-€5 range and home delivery around €7.80–7.90. Even in Q4, increases were marginal- for example, parcel shop delivery at €5.89 in Q4 versus €5.83 in Q3.
The shift came in 2025. By Q3, parcel lockers averaged €5.00 and parcel shops €5.11 - 10–13% lower than the prior holiday season. Home delivery also dipped to €7.30 from €7.91 in Q4 2024. This gradual decline suggests Danish webshops began competing more actively on delivery price or carriers pressed the prices further down.
Finland
Finland remains the most expensive Nordic market for delivery - especially for home delivery. In 2024, Finnish shoppers paid €12–13 for home delivery, nearly double Sweden’s average. Out-of-home methods were also high at €7+. Prices climbed steadily through 2024, with parcel shops up 12% by Q4.
In 2025, home delivery crept even higher, peaking at €12.90 in Q2. But by Q3, parcel locker and shop fees had fallen sharply - down about 10% from Q2, back to early-2024 levels. Home delivery stabilised around€12.50.
Norway
Norway experienced the most pronounced swings. In 2024, home delivery peaked at €10.08 in Q2, while parcel lockers (€8.21) and parcel shops (€9.16) hit highs in Q3. Interestingly, Q4 home delivery was lower than earlier in the year at €9.55.
By 2025, Norwegian webshops had cut prices heavily, especially for out-of-home delivery. Parcel lockers fell from over €8in late 2024 to €6.64 by Q3 2025- a 20% year-on-year drop. Parcel shop delivery followed a similar pattern, down about €1.20 on average versus Q4 2024. Home delivery also eased slightly to €9.25 by Q3.
The widening price gap between home and pickup options suggests a deliberate push to shift volume to more cost-efficient methods. For carriers, Norway highlights how quickly competitive conditions can change - and the need to adjust pricing strategies in real time.
To summarize the country trends, Table 1 highlights how delivery fees in Q3 2025 compare to the last peak season (Q42024). Most markets saw notable declines in that period, especially for out-of-home deliveries:
Table 1: Average delivery price in Q4 2024 vs Q3 2025, by country and delivery method. Prices fell in most categories (especially parcel box and parcel shop deliveries) as of mid-2025, compared to the last holiday season.
Delivery Method Trends: Parcel Box vs. Parcel Shop vs. Home
Data clearly shows that out-of-home delivery is significantly cheaper for consumers in urban areas – a natural effect when carriers can deliver 5–10 times more parcels per driver compared with home delivery.
Parcel box (locker) delivery
· Cheapest option across all markets by 2025(~€5–6.5).
· Prices spiked in 2024 (e.g. Norway €6.6 → €8.3)but dropped back sharply in 2025.
· Volatility suggests retailers test price sensitivity, then reset as competition kicks in.
Parcel shop(pickup point) delivery
· Typically a few cents above lockers, but fell notably in 2025.
· Norway: from ~€9 in 2024 to €7.2 by Q3 2025.
· Pricing gap with home delivery widened, creating strong incentives for consumers to choose pickup.
Home delivery
· Premium service, consistently the most expensive.
· Held steady through 2024–25: ~€7.5 in SE/DK,~€9.3 in NO, ~€12.5 in FI.
· Only small price drops, with Sweden (-13% YoY)the exception.
· Discounts remain rare and tied to high order values.
The bigger picture
Out-of-home delivery became cheaper in 2025, while home delivery kept its premium. This reflects a conscious decision: steer demand towards lockers and pickup points to cut last-mile costs and ease peak-season pressure. Black Week 2024 showed the effect in practice - locker usage rose by four percentage points and delivery times improved as shoppers embraced flexible collection (source: ingrid.com).
For logistics providers and retailers, aggressive pricing on out-of-home delivery seems to become a core lever: it nudges cost-conscious consumers, reduces operational strain, while keeping satisfaction high. But the gap has limits - home delivery still anchors convenience expectations and remains a profit lever. The real challenge is balance: keeping lockers and pickups highly attractive without eroding the value or accessibility of home delivery.
Collaboration between retailers and logistics providers is key here, ensuring service levels meet expectations as more customers choose out-of-home - seen clearly during Black Week, when lockers not only gained share but also delivered faster on average (source: ingrid.com).
Outlook forQ4 2025: What to Expect in the Peak Season
To keep the forecast transparent, we applied a simple model: for each country × delivery method, we took the Q4-over-Q3 seasonal change from 2024 and applied that ratio to Q3 2025 levels. Where 2025 trended lower than 2024, we also include a conservative midpoint between Q3 2025 and that baseline.
Regional forecast (Q4 2025)
· Parcel box(lockers): €5.6–6.0
· Parcel shop(pickup): €6.1–6.3
· Home delivery: €9.0–9.2
Seasonal lift from Q3 to Q4 looks modest. Home delivery remains the premium option, while lockers and parcel shops stay clearly cheaper.
By market
· Sweden: home ~€8.0 (flat vs last year); parcel shop ~€5.3 and lockers ~€5.0 (well below last year).
· Denmark: home ~€7.4; parcel shop ~€5.2; lockers ~€5.1 (all lower than last year).
· Finland: home ~€12.5 (still high); parcel shop ~€7.3; lockers ~€6.4 (both down year-on-year).
· Norway: home ~€9.25 (slightly below last year); parcel shop ~€7.1; lockers ~€6.7 (~20%down year-on-year).
Summary outlook for Q4 2025
Nordic delivery prices have eased through 2025 after peaking in late 2024, especially for out-of-home options (parcel box and parcel shop). Applying last year’s Q4-over-Q3 seasonality to current Q3 levels points to only small Q4 uplifts: lockers and pickups remain the low-cost choices, while home delivery stays premium and broadly flat.
Country patterns matter. Sweden and Denmark have lower 2025 bases and limited room for Q4 increases. Finland remains structurally high - especially on home delivery - so stability is more likely than hikes. Norway has corrected sharply this year, with retailers continuing to nudge volume toward cheaper lockers and pickups.
The underlying pricing strategies are clear:
· Continued shift to out-of-home delivery. Lower pricing here is deliberate - directing volume away from costly home delivery and easing last-mile strain.
· Home delivery as a premium anchor. Price cuts are modest; competition is about service quality (slots, ETAs, first-attempt success) rather than cents.
· Seasonal resets. After Christmas, prices ease in Q1—a cycle webshops use to stay competitive in slower months.
Finally, weigh this outlook against external factors that can quickly shift the picture: capacity constraints and consumer sentiment. If sentiment weakens, retailers may lean harder on thresholds and targeted incentives.
When starting an online store, businesses can either build a custom site from scratch or choose a ready-made e-commerce platform to manage their online sales. Over the years, a variety of commerce platforms have emerged - from large international solutions like Shopify and WooCommerce to smaller local specialists such as Dandomain in Denmark or Voog in Estonia. Choosing the right platform is a crucial decision not only for merchants, but also for the ecosystem of plug-in developers and service providers around these platforms. Not all add-ons work with every framework, so understanding a platform’s market penetration in each region is key to gauging its success and where to invest resources.

In this article, we take a data-driven look at the most widely used e-commerce platforms across selected European countries. The analysis spans 17 markets (Belgium, Bulgaria, Switzerland, Germany, Denmark, Estonia, Finland, Hungary, Iceland, Italy, Lithuania, Latvia, the Netherlands, Norway, Romania, Sweden, and Slovakia), covering a total of over 600,000 active webshops (online stores) identified in these countries. The findings confirm that two platforms dominate the landscape: WooCommerce - the open-source plugin for WordPress - and Shopify - the popular SaaS commerce platform. Together, these two power roughly 70-73% of all identified webshops in these markets. WooCommerce alone accounts for about 40% of the stores, making it the preferred solution overall, while Shopify powers around 30% of the stores, having rapidly grown in recent years. This duopoly leaves a long tail of other platforms sharing the remaining ~30% of the market. Nonetheless, those “other” platforms number in the tens of thousands of sites - for instance, over 15,000 webshops use PrestaShop and more than 13,000 use Magento across these countries - indicating significant niches and opportunities still exist beyond the top two.
It’s likely no surprise that Shopify and WooCommerce dominate across Europe’s e-commerce scene. But who are the other key players in each country, and how do platform preferences vary by market? Below, we break down the leading commerce platforms in each country, highlighting local trends, growth patterns, and the fit of certain platforms to regional needs.
Platform Popularity by Country
Belgium 🇧🇪
Belgium has roughly 20,534 active e-commerce sites in total. The Belgian market is notable for being one of the few where Shopify takes the top spot in our analysis. About half of Belgian webshops (estimated 10,233 sites) are built on Shopify. The next most popular framework is WooCommerce with around 5,181 sites (about 25% share). Combined, Shopify and WooCommerce power roughly 75% of Belgium’s online stores. The remaining quarter is split among other platforms.
PrestaShop is the third most common, used by ~1.7k sites (~8%), followed by Magento (~1.1k sites, ~5%). Notably, Lightspeed - a platform known for its integrated point-of-sale and e-commerce (and which acquired a Dutch e-commerce provider - SEOshop - popular in Benelux) - powers around 765 Belgian webshops (~4%). This suggests a decent niche in Belgium for platforms that cater to omnichannel retail.
Overall, while global solutions lead in Belgium, a mix of mostly European platforms (PrestaShop, Lightspeed) make up the rest, indicating Belgian merchants have a range of mature solutions to choose from.
Bulgaria 🇧🇬
Bulgaria’s e-commerce market comprises around 8,554 - a smaller market where open-source solutions have a strong foothold. WooCommerce is the clear leader, used by roughly 4,625 Bulgarian online stores (over 54% of the total). The second place goes to OpenCart (about 1,507 sites, ~18%), an open-source platform historically popular in Eastern Europe. Shopify, which is second in many other countries, ranks third in Bulgaria with ~1.3k sites (around 15%). This suggests that many Bulgarian merchants favor self-hosted, cost-effective solutions (WooCommerce, OpenCart) over SaaS. PrestaShop is next with a few hundred sites (~304, ~3.5%), followed by Magento (267 sites). Local Bulgarian-specific platforms have a limited presence - for example, CloudCart (a Bulgarian e-commerce platform) appears further down with only a few dozen sites. In summary, Bulgaria’s platform distribution is dominated by WooCommerce and other open-source frameworks, likely due to their flexibility and low cost, while Shopify is present but not as dominant as elsewhere.
Switzerland 🇨🇭
Switzerland is home to about 33,395 online shops. The Swiss e-commerce landscape is led by the same global players, but with a twist. WooCommerce is the most used platform here, powering roughly 12,168 webshops (around 45% of the market). Shopify follows closely with about 9,841 shops (~36% share). Together they account for over 80% of Swiss stores. The remaining ~19% of sites are on a long tail of other solutions.
PrestaShop is the third-ranking platform (about 1.5k sites, ~4-5%), and Magento comes next (~817 sites, ~2%). Shopware, a German-born platform, also has a modest presence (~554 sites) in Switzerland. One of the only notable local players is PepperShop, a Swiss e-commerce software; however, it accounts for only a few hundred stores (roughly 374 identified) - a relatively small 1% share.
In essence, Switzerland’s retailers gravitate strongly toward the big international platforms, and despite having local solutions like PepperShop, these haven’t gained major traction against WooCommerce and Shopify.
Germany 🇩🇪
Germany’s large and mature e-commerce market (with around 133,860 webshops identified) has undergone a significant shift in recent years. Shopify has surged in popularity to become the number one e-commerce platform among German merchants, especially SMEs (cedcommerce.com). Our data shows about 57,000+ German online stores running on Shopify (roughly 42-43% of all German webshops). This marks a major change, as traditionally German-built solutions were dominant. Now, WooCommerce is in second place with about 32,000 sites (~24% share). Combined, these two account for roughly two-thirds of German stores. German-origin platforms still play an important role: Shopware - known for its robust, customizable platform - powers about 9,400 sites (~7%) in Germany. Another local contender is JTL-Shop, which along with Shopware caters to merchants needing advanced inventory and ERP integrations; JTL is used by ~4,000 stores (~3%) (and notably, JTL holds around 12% share in some analyses focused on SMB segment) (cedcommerce.com).
Magento and ePages (a SaaS platform often used by hosting providers in Europe) each are used by roughly 4-7k German stores (around 3-5% share each). Overall, the trend in Germany is clear: Shopify’s user-friendly interface and accessible pricing have propelled it past traditional German platforms (cedcommerce.com). Shopware and others remain relevant for businesses that require more localized support or complex customizations, but the ease of SaaS has won over many German SMEs. It’s also worth noting that custom-built e-commerce solutions (proprietary platforms) still exist in Germany - in fact, we can see that custom solutions account for close to half of e-commerce traffic in Germany - meaning many high-volume retailers use their own systems. By sheer number of sites, however, custom builds are only a small fraction (only ~2% of German stores in our count), as most companies choose established platforms.
Denmark 🇩🇰
Denmark has about 39,460 online stores in total. The Danish market is dominated by the two usual suspects: WooCommerce and Shopify. WooCommerce slightly leads with around 15,447 webshops, about 39% of the market. Shopify is a close second at roughly 14,689 stores (~37%). Combined, they power roughly 76% of Danish e-commerce sites - a very tight race between the open-source and SaaS approach. The remaining quarter of the market includes several platforms, notably a strong local player. Dandomain - a Denmark-based e-commerce platform - accounts for about 2,339 sites, making it the third most popular choice (~6% share). Dandomain’s local roots and integration with Danish hosting services likely contribute to its continued popularity in Denmark.
After that, we see Magento (~1.3k sites, 3%) and PrestaShop (~1.0k sites, ~2.5%) in the rankings. Additionally, Denmark has a few hundred webshops on Optimizely (formerly Episerver, a Swedish enterprise platform) and SmartWeb (a Danish SMB platform), reflecting that some Danish businesses opt for specialized solutions.
In summary, Denmark mirrors the broader trend of WooCommerce and Shopify dominance, with a notable chunk of merchants sticking to a home-grown solution (Dandomain) for its local advantages.
Estonia 🇪🇪
Estonia’s e-commerce scene, while small in absolute numbers (around 9,956 webshops total), is unique in having an extremely dominant #1 platform. WooCommerce is used by about 5,846 Estonian webshops - roughly 68% of the country’s online stores. This gives Estonia the distinction of the highest WooCommerce market share among the countries analyzed.
Shopify is a distant second with only 739 sites in Estonia (~9% share). In third place is a local platform: Voog, an Estonia-based website and commerce platform, which powers about 570 webshops (around 6% of the market). Voog offers native Estonian-language support and caters to small and mid-sized businesses, which explain its solid foothold despite WooCommerce’s dominance.
The remaining ~17% of Estonian stores are split among various other providers (about 1,800 stores in total). Aside from Voog, no other single platform has more than a few hundred sites in Estonia - for example, PrestaShop and OpenCart have a few hundred each, and there’s a long tail including Ecwid, Magento, and others.
In essence, Estonia is a case where one open-source solution (WooCommerce) completely outshines the competition, with local specialized services like Voog carving out a niche alongside it.
Finland 🇫🇮
Finland has roughly 18,632 e-commerce sites in total. Like most Nordic markets, the top two platforms are WooCommerce and Shopify. WooCommerce is used by about 8,126 Finnish webshops (approximately 44% market share). Shopify is the second choice with around 4,835 sites. Combined, these two make up roughly 70% of Finland’s online stores.
The remaining 30% is quite fragmented. Notably, Finland has a higher proportion of custom-built stores than many other countries - about 5% of Finnish webshops are custom solutions (roughly 800+ sites). This reflects Finland’s strong tech culture and businesses opting for bespoke e-commerce solutions tailored to specific needs.
Among packaged platforms, a local contender MyCashFlow stands out as the third most popular in Finland. MyCashFlow powers about 1,327 Finnish webshops (~9% of the market). This platform is Finland-based and has likely gained trust for its local support and features, showing that domestic providers can hold their own niche.
After MyCashFlow and custom builds, other platforms in Finland include PrestaShop (~3% share) and Magento (just over 2%), plus smaller presences of Vilkas, Squarespace/Wix, and others. In summary, Finland’s e-commerce platform distribution is led by global platforms, but with a notable segment of merchants choosing local solutions or fully custom builds to leverage local expertise and meet specific requirements.
Hungary 🇭🇺
Hungary’s online retail market includes about 27,060 webshops. Unlike many Western European countries, Hungary’s top platforms after WooCommerce are local ones. WooCommerce is number one with roughly 12,605 stores (~47% share) - nearly half of all Hungarian e-shops run on WordPress. The second most popular platform is Unas, a Hungary-based e-commerce platform, used by around 4,605 stores (~17%). Close behind is Shoprenter (another Hungarian SaaS e-commerce solution) with about 3,611 stores (~13%). These local platforms have been long-standing options in Hungary, offering Hungarian language support and local integrations (payments, delivery) which likely contribute to their significant uptake.
Shopify comes in fourth place in Hungary with roughly 2,511 stores (~9%), indicating that the global SaaS giant lags behind the domestic services here. Other platforms collectively make up the remaining ~14% of the market - for instance, OpenCart (around 989 sites, ~3.7%), Magento (~578 sites, ~2%), and a variety of smaller solutions including Shopware, PrestaShop, and some Romanian/Central European platforms that show minor presence (e.g. Shoptet, a Czech platform, appears with a few hundred Hungarian shops).
The Hungarian case underlines how local e-commerce providers can capture a large portion of the market by catering to regional needs (language, local logistics), even as global platforms are available.
Iceland 🇮🇸
Iceland’s e-commerce sector is the smallest in this group - we identified roughly 1,712 online stores in Iceland. Interestingly, Shopify absolutely dominates this tiny market. Approximately 1,169 Icelandic webshops run on Shopify, which is about 68% of all online stores in the country. This is one of the highest national market shares for Shopify among the countries examined. WooCommerce is the second most common, with around 507 stores (~30%).
Combined, Shopify and WooCommerce account for an astonishing ~98% of Iceland’s e-commerce sites - essentially a duopoly. This leaves very little room for other platforms: the third-place contender (far behind) is Magento, with only about 16 identified sites (<1%). A handful of stores use OpenCart (a dozen sites) or PrestaShop (just 4 sites).
The overwhelming preference for Shopify in Iceland could be due to the lack of any local e-commerce solution and the appeal of an easy-to-deploy, cloud-based platform for a small market. Additionally, many Icelandic businesses likely cater to international audiences or use English online, making a globally-oriented platform like Shopify a natural choice.
In summary, Iceland’s platform landscape is an outlier: Shopify is nearly synonymous with e-commerce here, with WooCommerce capturing most of the remainder and virtually no other platform having any significant footprint.
Italy 🇮🇹
Italy has an estimated 72,334 active webshops in this analysis. The Italian e-commerce platform distribution skews heavily towards WooCommerce. WooCommerce is used by roughly 39,852 Italian online stores, about 55% of the total. This aligns with WooCommerce’s popularity among small-to-medium businesses in many European countries. Shopify is the second most used platform in Italy, powering about 17,804 stores (~24-25% share). Together, WooCommerce and Shopify make up nearly 80% of Italy’s e-commerce sites.
In third place is PrestaShop, which has a strong user base in Italy (around 6,349 stores, roughly 9% share). PrestaShop’s open-source platform, originally from France.. Beyond the top three, no single platform has more than a single-digit percentage of share. Custom-built solutions account for around 2-3% (we identified ~2,061 custom sites) indicating some companies opt for fully bespoke stores.
Magento, once a leading platform for mid-sized and enterprise merchants, now powers only about 1,938 Italian stores (~2.7%) - showing a decline in relative popularity as easier solutions have gained ground. Other platforms in Italy include smaller counts of OpenCart, Wix (for simpler websites with stores), and local SaaS offerings (though none of the local Italian platforms stand out in the data - the market seems largely served by international or open-source solutions).
In summary, Italy leans strongly on WooCommerce for a majority of shops, with Shopify as a robust second choice and PrestaShop still holding a notable third-place share. This suggests a mix of merchants: many favoring WooCommerce for its low cost and WordPress integration, and a significant group opting for Shopify’s simplicity, while an older guard or specific segment continues with PrestaShop and Magento.
Lithuania 🇱🇹
Lithuania’s e-commerce market, with about 14,604 webshops, also shows a strong preference for WooCommerce. Around 7,983 Lithuanian online stores (about 55%) are built on WooCommerce, making it the dominant platform by far. Shopify is the second most popular, used by roughly 2,734 stores (~19% share). Combined, these two make up roughly 74% of the Lithuanian market, similar to other countries.
However, Lithuania has a more notable third-place presence than some others: PrestaShop powers about 1,706 stores (~12% of the market). In fact, PrestaShop is not far behind Shopify here - 12% vs 18% - showing that PrestaShop remains a viable choice for many Lithuanian merchants.
After PrestaShop, the remaining ~15% of sites are on a mix of platforms. OpenCart is fairly common (around 1,052 stores, ~7%) and there is a long tail of small platforms and custom sites. Notably, two Lithuanian-developed e-commerce platforms, Shopiteka and Verskis, appear in the data - but they rank among the smaller players, together accounting for only a couple hundred stores. For instance, Verskis is used by fewer than 100 sites (only ~96 identified), and Shopiteka similarly under 100. This indicates that, unlike some other Eastern European markets, local Lithuanian solutions haven’t achieved high popularity against the global and open-source options.
Overall, Lithuanian e-commerce is heavily reliant on WooCommerce’s ecosystem, with a significant minority on Shopify and a continued loyal user base on PrestaShop - reflecting perhaps the influence of neighboring Poland/Europe where PrestaShop is stronger, and the needs of merchants who prefer an open-source but more standalone platform than WooCommerce.
Latvia 🇱🇻
Latvia has approximately 6,049 online stores in the database. The platform distribution in Latvia is a bit more balanced at the top than in Lithuania or Estonia, but WooCommerce still leads. Around 1,841 Latvian webshops use WooCommerce, making up about 37% of the market. Shopify is the second most common at about 1,201 stores (~24% share). Together, they account for roughly 61% of Latvian online shops.
The remaining 39% is divided among various other platforms. One notable aspect of Latvia is the significant use of other solutions: OpenCart is the third-largest platform with roughly 713 sites (~12%) based on our data. Following that, a considerable number of sites are custom-built (~471 sites, ~8%), indicating a chunk of merchants opt for tailor-made solutions. PrestaShop comes next with about 333 stores (~5.5%).
Latvia also has its own local website builder/e-commerce tool named Mozello, which appears to power around 270 stores (around 4-5% of the market) - a non-trivial share for a local platform. Mozello offers easy bilingual site creation (useful in Latvia’s multilingual environment), which might explain its uptake.
All other platforms (Magento, Ecwid, etc.) each account for only a few percent or less. The data suggests that while WooCommerce and Shopify are very important in Latvia, a large minority of merchants use a mix of open-source, custom, or regional tools, making it a more diverse platform ecosystem in relative terms (nearly 40% using “other” platforms beyond the big two).
Netherlands 🇳🇱
The Netherlands boasts a highly developed e-commerce market, with about 112,906 webshops counted in this analysis. Dutch online retailers have a clear favourite: WooCommerce. We found roughly 38,316 Dutch webshops using WooCommerce, which is about 46% of all online shops in the Netherlands. This aligns with other findings that WooCommerce has a very strong presence in the Dutch market. Shopify is the second-largest platform with around 21,534 stores (~26% share). Together, WooCommerce and Shopify account for approximately 72% of the market, leaving just over a quarter of sites on other platforms.
The Netherlands has a diverse mix of other e-commerce solutions making up that remaining ~27%. One notable player is Optimizely (formerly Episerver Commerce), an enterprise-level platform - about 7,928 Dutch sites (~7%) use Optimizely. This is a significant share and suggests many mid-to-large Dutch businesses invest in enterprise .NET-based solutions (possibly thanks to a robust ecosystem of agencies for Optimizely in the region).
Magento is also present, with around 6,176 sites (~5.5%). The Dutch market also continues to support Lightspeed (formerly SEOshop in Europe) with roughly 3,820 sites (~3.4%). Lightspeed’s continued use is expected given its local origins and focus on omnichannel retailers (brick-and-mortar stores integrating online). Additionally, a homegrown platform MyOnlineStore (also known as JouwWeb) powers about 3,600 shops (a little over 3%). Other platforms in the Netherlands include PrestaShop, Wix, Shopware, and custom builds, but each of those represents only 2-3% or less.
The key takeaway is that the Dutch e-commerce environment is heavily weighted toward WooCommerce for smaller businesses and content-driven stores, with Shopify catching up for pure-play online merchants, while a substantial segment of more complex or established retailers opt for enterprise or locally tailored solutions like Optimizely and Lightspeed.
Norway 🇳🇴
Norway’s e-commerce market includes around 17,316 webshops. The competition between WooCommerce and Shopify is particularly tight in Norway. WooCommerce is used by roughly 5,346 Norwegian webshops (39% share). Shopify is a very close second with about 4,931 sites (36% share). That’s a gap of only a few hundred sites, or about 3 percentage points, in WooCommerce’s favour. This near parity shows how strongly Shopify has gained traction even in markets traditionally dominated by open-source solutions.
The remaining ~24% of Norwegian webshops (about 3,192 sites) run on various other providers. Norway has a couple of notable local platforms in this “others” category. MyStore, a Norwegian-founded e-commerce platform, is the third most popular choice with about 1,071 sites (~6% share). MyStore’s presence indicates that some Norwegian merchants prefer a domestic solution, possibly for its local language support and integration with Norwegian payment or logistics options. Another Norwegian platform 24Nettbutikk accounts for around 701 sites (~4%), making it the fourth-ranked platform.
After these, the rest is fragmented: Magento has a few hundred sites (~2.7%), and there are many small contributions from others like Wix, WooCommerce’s forked variants, etc. The Norwegian e-commerce platform landscape can be summarized as a neck-and-neck race between the top global two, with local players carving out around 10% of the market combined (not insignificant for a country of Norway’s size). The close competition also suggests that platform choice in Norway might come down to specific business preferences - WooCommerce for content flexibility or existing WordPress usage, versus Shopify for ease of use - rather than clear-cut market leader advantage.
Romania 🇷🇴
Romania’s e-commerce market (approximately 31,892 webshops) shows a strong lead for WooCommerce as well, with some influence of local platforms. WooCommerce is estimated to power about 17,262 Romanian online stores, which is roughly 54% of the total. This is a majority share, indicating WooCommerce’s popularity among Romanian merchants, likely due to its low cost and flexibility in a price-sensitive market. The second most popular platform is Shopify, used by around 5,396 stores (~17%). Shopify’s share in Romania, while significant, is lower than in many Western countries.
The third place goes to PrestaShop with roughly 2,327 stores (~7%). PrestaShop has a community in Romania (the platform’s multilingual support and open source nature align well with local developer communities). Close behind, OpenCart is the fourth most used, powering around 2,179 stores (~6.8%). OpenCart has been historically popular in Eastern Europe for its simplicity.
Importantly, Romania has a couple of homegrown e-commerce solutions that make the top-five list. Gomag, a Romanian e-commerce SaaS platform, is used by about 1,773 stores (~5.6%). Another local platform, MerchantPro (formerly ShopMania BIZ), appears with a few hundred stores (~896 identified, ~3%). These local providers offer Romanian-language interfaces and local payment/shipping integrations, which can attract merchants. While Gomag’s share is notable, it still trails far behind WooCommerce.
The remaining portion of the Romanian market includes Magento (~828 sites, ~2.6%), along with other small players (including some regional ones like OpenCart as mentioned, and possibly osCommerce and Oxid with tiny footprints). The trend in Romania is that WooCommerce overwhelmingly dominates, with Shopify being the main international alternative, but local e-commerce service providers like Gomag have carved out respectable niches by addressing country-specific needs.
Sweden 🇸🇪
Sweden has a robust e-commerce sector with about 38,965 webshops. The Swedish platform distribution looks somewhat similar to Norway’s. WooCommerce holds the lead with roughly 13,293 sites (~39% of Swedish webshops). Shopify is not far behind at about 11,354 sites (around 34% share). The difference between them is only about 5% of the market (~2,000 stores), indicating a close contest in Sweden as well. Combined, these two account for roughly 73% of Swedish online stores.
The remaining 26-27% use other platforms. One noteworthy local platform in Sweden is Quickbutik, which is the third most popular solution with about 2,809 sites (~7.2%). Quickbutik is a Swedish e-commerce platform geared toward small businesses, and its ~7% share shows a significant minority of merchants opt for it, possibly for its simplicity and Swedish-language support. Another local contender is Wikinggruppen (part of Visma), which appears with a few hundred stores (~528 identified, around 1.4%).
Sweden also has a relatively higher incidence of custom-built stores - around 1,151 custom e-commerce sites (~3.0%) were noted, which could include large retailers and boutiques with bespoke solutions. Magento is used by around 932 sites (~2.4%), and PrestaShop by a similar number (~728 sites, ~1.9%). Additionally, Wix and Squarespace (general website builders with commerce capabilities) together account for a few percent (Wix around 480 sites, for instance).
In summary, Sweden’s e-commerce platforms are dominated by the top global two, but a healthy ecosystem of local services like Quickbutik and other specialized platforms thrives in the shadow of those giants. The competition between WooCommerce and Shopify in Sweden is intense - only a 4% market share difference - showing that Swedish merchants are split between the convenience of Shopify and the flexibility of WooCommerce, with neither running away completely with the market.
Slovakia 🇸🇰
Slovakia, with around 17,616 online stores, presents an interesting case where a regional platform plays a major role. WooCommerce is still number one at roughly 7,144 Slovakian webshops (about 41% of the market). However, unlike most countries where Shopify is the automatic second, in Slovakia the second-place platform is Shoptet with about 3,502 webshops (~20-22% share). Shoptet is a Czech-based e-commerce platform very popular in Central Europe, and its strong showing in Slovakia (over a fifth of Slovak webshops) is testament to that regional influence.
Shopify, by contrast, is less prevalent - it actually ranks fourth in Slovakia. The third spot belongs to PrestaShop (~1,309 stores, ~7%) and Shopify comes in fourth with around 1,183 stores (~6.7%).
The remaining ~25% of Slovak stores are split among other providers. After Shopify, OpenCart accounts for roughly 800 stores (~4.5%). There are also a couple of local Slovak/Czech solutions further down: for example, Webareal (~727 stores) and eShop Rýchlo (eShop Rychle) (~529 stores) each have a small share. Upgates, another Czech platform, appears with a few hundred Slovak shops as well. The key insight for Slovakia is that regional integration matters - Shoptet’s platform offers integrations to Central European marketplaces and local services, which has made it more popular than even Shopify for Slovak merchants. This is a reminder that in certain markets, being attuned to local commerce ecosystems (language, marketplaces like Heureka or Alza, local payment gateways) can give a platform a significant edge. WooCommerce still leads thanks to its general appeal and flexibility, but Shoptet’s high adoption shows that merchants will embrace a solution that caters to their regional business needs, even if a global option is available.
Trends and Takeaways
Looking across all these countries, a few clear trends emerge.
1. WooCommerce and Shopify dominate the European e-commerce platform market.
In virtually every country analyzed, these two platforms account for well over half (often around 70% or more) of all online stores. WooCommerce tends to lead in markets with strong DIY or open-source communities, while Shopify often gains in markets where turn-key solutions are in demand. Their combined dominance poses a high barrier to entry for any new platforms - unseating either would require not just converting a few merchants, but a massive migration that seems unlikely unless a radically better value proposition comes along.
2. Local and regional platforms still matter, especially in certain countries.
We see this clearly in places like Hungary (Unas, Shoprenter), Norway (MyStore, 24Nettbutikk), Finland (MyCashFlow), Czechia/Slovakia (Shoptet, Webareal), and Romania (Gomag, MerchantPro). These platforms succeed by catering to local languages, regulations, and business practices, offering features or integrations out-of-the-box that global platforms might not handle as smoothly (for example, integration with local marketplaces, tax rules, or popular domestic payment methods).
While none of these local providers comes close to dethroning the top two in absolute numbers, they often secure a solid third-place position - sometimes even second, as Shoptet does in Slovakia - capturing anywhere from 5% to 25% of their home market. This indicates an industry fit advantage: in specific niches or regions, a tailored solution can beat a one-size-fits-all global platform. For e-commerce leaders, this means it’s important to be aware of and integrated with local platforms when operating in those markets, as they may have a loyal user base.
3. Open-source vs. SaaS dynamics
The data reflects a broader shift from open-source, self-hosted carts (like Magento, PrestaShop, OpenCart) toward SaaS and cloud-hosted solutions (like Shopify, and to an extent local SaaS like Shoprenter or Shoptet).
A decade ago, platforms like Magento and PrestaShop were among the top choices in Europe. Today, Magento powers only a small percentage of stores in these countries (generally 2-5%), and PrestaShop, while still significant in some markets (up to ~12% in Lithuania, ~9% in Italy), is far behind the leaders. This doesn’t mean these platforms are disappearing - indeed, Magento remains a top choice for many high-traffic and complex stores (often enterprise B2C or B2B, where its scalability and customization shine, even if the count of Magento stores is low) (mgt-commerce.commgt-commerce.com).
PrestaShop similarly maintains a strong community among mid-sized merchants who prefer open source. However, the growth seems to be with easier-to-deploy, maintenance-free solutions. Shopify’s growth is evident across Europe, even in traditionally resistant markets like Germany (where it reportedly grew its market share 35% since 2018 to take the lead (cedcommerce.com). WooCommerce, while open-source, benefits from being a plugin to WordPress - thus riding the coattails of the world’s most popular CMS - and remains accessible to non-developers via hosting providers and one-click installs, keeping it competitive in the era of SaaS.
4. Platform capabilities and industry fit
Different platforms tend to appeal to different segments of the market:
WooCommerce is favored by content-driven businesses (who already use WordPress) and smaller merchants who want full control with minimal cost. It’s highly flexible with plugins, but requires more hands-on management. The data shows WooCommerce having especially high shares in countries with strong WordPress usage and developer communities (e.g., Estonia, Italy, Netherlands).
Shopify appeals to merchants who prioritize ease of use, reliable hosting, and a rich app ecosystem without needing technical know-how. Its surge in countries like Germany and Iceland underscores how a user-friendly, all-in-one solution can rapidly gain trust, even in markets that once prized self-hosted solutions (cedcommerce.com). Shopify is also increasingly capable of serving larger merchants (Shopify Plus), which may further grow its share among enterprises.
PrestaShop and OpenCart still appeal to budget-conscious or technically oriented merchants, especially in Eastern and Southern Europe, who want an open-source store but perhaps find Magento too heavy. These platforms are often used for small-to-mid shops that need specific customizations and local hosting. Their share is shrinking in many places, but they remain part of the mix (often in the 5-15% range in various countries).
Magento (Adobe Commerce) has shifted to an enterprise focus. The relatively low count of Magento stores hides the fact that many larger retailers and B2B wholesalers run on Magento for its advanced features and scalability. For example, Magento is estimated to hold about an 18% share of Europe’s e-commerce revenue or enterprise usage (though only a few percent of the count of stores) (mgt-commerce.commgt-commerce.com). It remains strong in specific sectors like fashion and auto parts in Europe, where its robustness and the availability of skilled Magento developers are valued.
Local platforms often differentiate through localized capabilities: e.g., Shoptet’s integration with Central European marketplaces, MyCashFlow’s understanding of Finnish payment systems, or Dandomain’s tie-ins with Danish ERP software. Industry-wise, some local platforms cater to certain industries (for instance, Lightspeed’s strength among restaurants and brick-and-mortar retail with its POS integration). Quickbutik in Sweden markets itself to boutique retailers. These platforms might not scale globally, but they fit the industry and regional needs of their target users extremely well, ensuring their survival amid global competition.
5. Growth trajectories
The overall trend is a consolidation toward a few major platforms (especially Shopify and WooCommerce). Shopify’s aggressive growth is a common thread - it’s growing its share in essentially every market, often at the expense of older local solutions or smaller platforms. WooCommerce also continues to grow in absolute terms (the number of WooCommerce stores is rising), though its market share in some places is plateauing or falling slightly where Shopify gains. Platforms like Magento and PrestaShop, while still gaining new sites, are growing much slower or even declining in share as merchants replatform to easier solutions. Local platforms show mixed trends: some are growing (e.g., Shoptet’s expansion from Czech into Slovakia, or Gomag in Romania attracting sellers moving online), while others may be slowly losing ground if they can’t match the features or marketing of the global competitors. For example, the data for Germany implies platforms like Shopware and JTL, despite being robust, have ceded the #1 spot to Shopify and may need to innovate to maintain relevance.
In conclusion, understanding which e-commerce platforms dominate in each country is valuable for anyone in the e-commerce industry. If you’re a technology or service provider, these insights help in estimating your total addressable market on each platform and prioritizing integrations - for instance, focusing on WooCommerce and Shopify covers ~70% of shops off the bat, but if you target a country like Hungary or Slovakia, you’d miss a large chunk if you ignore local platforms. For e-commerce merchants or investors, knowing the popular platforms can guide you toward the solutions with the strongest local ecosystems (developers, agencies, plug-ins) in a given region.
Despite the pan-European dominance of WooCommerce and Shopify, the diversity of platforms in the remaining share is a reminder that one size does not fit all. Each market has its nuances, and platforms that align with local languages, regulations, cross-border possibilities or industry niches can capture significant share. As the e-commerce sector continues to grow and evolve, keeping an eye on platform popularity and trends in each country can provide a strategic advantage - whether that’s choosing a platform for your next webshop or deciding which markets to expand platform-specific services into. The data confirms a broad trend toward a few leading frameworks, but also highlights where opportunities lie in serving the ecosystems around the myriad of other platforms that together still power tens of thousands of European webshops.
Sources: The platform usage data is derived from a 2025 analysis of hundreds of thousands of European webshops (Tembi Market Intelligence and other sources). Additional context on regional platforms and market shares was taken from industry reports and studies. Each country section above cites specific data sources.
When starting an online store, businesses can either build a custom site from scratch or choose a ready-made e-commerce platform to manage their online sales. Over the years, a variety of commerce platforms have emerged - from large international solutions like Shopify and WooCommerce to smaller local specialists such as Dandomain in Denmark or Voog in Estonia. Choosing the right platform is a crucial decision not only for merchants, but also for the ecosystem of plug-in developers and service providers around these platforms. Not all add-ons work with every framework, so understanding a platform’s market penetration in each region is key to gauging its success and where to invest resources.
In this article, we take a data-driven look at the most widely used e-commerce platforms across selected European countries. The analysis spans 17 markets (Belgium, Bulgaria, Switzerland, Germany, Denmark, Estonia, Finland, Hungary, Iceland, Italy, Lithuania, Latvia, the Netherlands, Norway, Romania, Sweden, and Slovakia), covering a total of over 600,000 active webshops (online stores) identified in these countries. The findings confirm that two platforms dominate the landscape: WooCommerce - the open-source plugin for WordPress - and Shopify - the popular SaaS commerce platform. Together, these two power roughly 70-73% of all identified webshops in these markets. WooCommerce alone accounts for about 40% of the stores, making it the preferred solution overall, while Shopify powers around 30% of the stores, having rapidly grown in recent years. This duopoly leaves a long tail of other platforms sharing the remaining ~30% of the market. Nonetheless, those “other” platforms number in the tens of thousands of sites - for instance, over 15,000 webshops use PrestaShop and more than 13,000 use Magento across these countries - indicating significant niches and opportunities still exist beyond the top two.
It’s likely no surprise that Shopify and WooCommerce dominate across Europe’s e-commerce scene. But who are the other key players in each country, and how do platform preferences vary by market? Below, we break down the leading commerce platforms in each country, highlighting local trends, growth patterns, and the fit of certain platforms to regional needs.
Platform Popularity by Country
Belgium 🇧🇪
Belgium has roughly 20,534 active e-commerce sites in total. The Belgian market is notable for being one of the few where Shopify takes the top spot in our analysis. About half of Belgian webshops (estimated 10,233 sites) are built on Shopify. The next most popular framework is WooCommerce with around 5,181 sites (about 25% share). Combined, Shopify and WooCommerce power roughly 75% of Belgium’s online stores. The remaining quarter is split among other platforms.
PrestaShop is the third most common, used by ~1.7k sites (~8%), followed by Magento (~1.1k sites, ~5%). Notably, Lightspeed - a platform known for its integrated point-of-sale and e-commerce (and which acquired a Dutch e-commerce provider - SEOshop - popular in Benelux) - powers around 765 Belgian webshops (~4%). This suggests a decent niche in Belgium for platforms that cater to omnichannel retail.
Overall, while global solutions lead in Belgium, a mix of mostly European platforms (PrestaShop, Lightspeed) make up the rest, indicating Belgian merchants have a range of mature solutions to choose from.
Bulgaria 🇧🇬
Bulgaria’s e-commerce market comprises around 8,554 - a smaller market where open-source solutions have a strong foothold. WooCommerce is the clear leader, used by roughly 4,625 Bulgarian online stores (over 54% of the total). The second place goes to OpenCart (about 1,507 sites, ~18%), an open-source platform historically popular in Eastern Europe. Shopify, which is second in many other countries, ranks third in Bulgaria with ~1.3k sites (around 15%). This suggests that many Bulgarian merchants favor self-hosted, cost-effective solutions (WooCommerce, OpenCart) over SaaS. PrestaShop is next with a few hundred sites (~304, ~3.5%), followed by Magento (267 sites). Local Bulgarian-specific platforms have a limited presence - for example, CloudCart (a Bulgarian e-commerce platform) appears further down with only a few dozen sites. In summary, Bulgaria’s platform distribution is dominated by WooCommerce and other open-source frameworks, likely due to their flexibility and low cost, while Shopify is present but not as dominant as elsewhere.
Switzerland 🇨🇭
Switzerland is home to about 33,395 online shops. The Swiss e-commerce landscape is led by the same global players, but with a twist. WooCommerce is the most used platform here, powering roughly 12,168 webshops (around 45% of the market). Shopify follows closely with about 9,841 shops (~36% share). Together they account for over 80% of Swiss stores. The remaining ~19% of sites are on a long tail of other solutions.
PrestaShop is the third-ranking platform (about 1.5k sites, ~4-5%), and Magento comes next (~817 sites, ~2%). Shopware, a German-born platform, also has a modest presence (~554 sites) in Switzerland. One of the only notable local players is PepperShop, a Swiss e-commerce software; however, it accounts for only a few hundred stores (roughly 374 identified) - a relatively small 1% share.
In essence, Switzerland’s retailers gravitate strongly toward the big international platforms, and despite having local solutions like PepperShop, these haven’t gained major traction against WooCommerce and Shopify.
Germany 🇩🇪
Germany’s large and mature e-commerce market (with around 133,860 webshops identified) has undergone a significant shift in recent years. Shopify has surged in popularity to become the number one e-commerce platform among German merchants, especially SMEs (cedcommerce.com). Our data shows about 57,000+ German online stores running on Shopify (roughly 42-43% of all German webshops). This marks a major change, as traditionally German-built solutions were dominant. Now, WooCommerce is in second place with about 32,000 sites (~24% share). Combined, these two account for roughly two-thirds of German stores. German-origin platforms still play an important role: Shopware - known for its robust, customizable platform - powers about 9,400 sites (~7%) in Germany. Another local contender is JTL-Shop, which along with Shopware caters to merchants needing advanced inventory and ERP integrations; JTL is used by ~4,000 stores (~3%) (and notably, JTL holds around 12% share in some analyses focused on SMB segment) (cedcommerce.com).
Magento and ePages (a SaaS platform often used by hosting providers in Europe) each are used by roughly 4-7k German stores (around 3-5% share each). Overall, the trend in Germany is clear: Shopify’s user-friendly interface and accessible pricing have propelled it past traditional German platforms (cedcommerce.com). Shopware and others remain relevant for businesses that require more localized support or complex customizations, but the ease of SaaS has won over many German SMEs. It’s also worth noting that custom-built e-commerce solutions (proprietary platforms) still exist in Germany - in fact, we can see that custom solutions account for close to half of e-commerce traffic in Germany - meaning many high-volume retailers use their own systems. By sheer number of sites, however, custom builds are only a small fraction (only ~2% of German stores in our count), as most companies choose established platforms.
Denmark 🇩🇰
Denmark has about 39,460 online stores in total. The Danish market is dominated by the two usual suspects: WooCommerce and Shopify. WooCommerce slightly leads with around 15,447 webshops, about 39% of the market. Shopify is a close second at roughly 14,689 stores (~37%). Combined, they power roughly 76% of Danish e-commerce sites - a very tight race between the open-source and SaaS approach. The remaining quarter of the market includes several platforms, notably a strong local player. Dandomain - a Denmark-based e-commerce platform - accounts for about 2,339 sites, making it the third most popular choice (~6% share). Dandomain’s local roots and integration with Danish hosting services likely contribute to its continued popularity in Denmark.
After that, we see Magento (~1.3k sites, 3%) and PrestaShop (~1.0k sites, ~2.5%) in the rankings. Additionally, Denmark has a few hundred webshops on Optimizely (formerly Episerver, a Swedish enterprise platform) and SmartWeb (a Danish SMB platform), reflecting that some Danish businesses opt for specialized solutions.
In summary, Denmark mirrors the broader trend of WooCommerce and Shopify dominance, with a notable chunk of merchants sticking to a home-grown solution (Dandomain) for its local advantages.
Estonia 🇪🇪
Estonia’s e-commerce scene, while small in absolute numbers (around 9,956 webshops total), is unique in having an extremely dominant #1 platform. WooCommerce is used by about 5,846 Estonian webshops - roughly 68% of the country’s online stores. This gives Estonia the distinction of the highest WooCommerce market share among the countries analyzed.
Shopify is a distant second with only 739 sites in Estonia (~9% share). In third place is a local platform: Voog, an Estonia-based website and commerce platform, which powers about 570 webshops (around 6% of the market). Voog offers native Estonian-language support and caters to small and mid-sized businesses, which explain its solid foothold despite WooCommerce’s dominance.
The remaining ~17% of Estonian stores are split among various other providers (about 1,800 stores in total). Aside from Voog, no other single platform has more than a few hundred sites in Estonia - for example, PrestaShop and OpenCart have a few hundred each, and there’s a long tail including Ecwid, Magento, and others.
In essence, Estonia is a case where one open-source solution (WooCommerce) completely outshines the competition, with local specialized services like Voog carving out a niche alongside it.
Finland 🇫🇮
Finland has roughly 18,632 e-commerce sites in total. Like most Nordic markets, the top two platforms are WooCommerce and Shopify. WooCommerce is used by about 8,126 Finnish webshops (approximately 44% market share). Shopify is the second choice with around 4,835 sites. Combined, these two make up roughly 70% of Finland’s online stores.
The remaining 30% is quite fragmented. Notably, Finland has a higher proportion of custom-built stores than many other countries - about 5% of Finnish webshops are custom solutions (roughly 800+ sites). This reflects Finland’s strong tech culture and businesses opting for bespoke e-commerce solutions tailored to specific needs.
Among packaged platforms, a local contender MyCashFlow stands out as the third most popular in Finland. MyCashFlow powers about 1,327 Finnish webshops (~9% of the market). This platform is Finland-based and has likely gained trust for its local support and features, showing that domestic providers can hold their own niche.
After MyCashFlow and custom builds, other platforms in Finland include PrestaShop (~3% share) and Magento (just over 2%), plus smaller presences of Vilkas, Squarespace/Wix, and others. In summary, Finland’s e-commerce platform distribution is led by global platforms, but with a notable segment of merchants choosing local solutions or fully custom builds to leverage local expertise and meet specific requirements.
Hungary 🇭🇺
Hungary’s online retail market includes about 27,060 webshops. Unlike many Western European countries, Hungary’s top platforms after WooCommerce are local ones. WooCommerce is number one with roughly 12,605 stores (~47% share) - nearly half of all Hungarian e-shops run on WordPress. The second most popular platform is Unas, a Hungary-based e-commerce platform, used by around 4,605 stores (~17%). Close behind is Shoprenter (another Hungarian SaaS e-commerce solution) with about 3,611 stores (~13%). These local platforms have been long-standing options in Hungary, offering Hungarian language support and local integrations (payments, delivery) which likely contribute to their significant uptake.
Shopify comes in fourth place in Hungary with roughly 2,511 stores (~9%), indicating that the global SaaS giant lags behind the domestic services here. Other platforms collectively make up the remaining ~14% of the market - for instance, OpenCart (around 989 sites, ~3.7%), Magento (~578 sites, ~2%), and a variety of smaller solutions including Shopware, PrestaShop, and some Romanian/Central European platforms that show minor presence (e.g. Shoptet, a Czech platform, appears with a few hundred Hungarian shops).
The Hungarian case underlines how local e-commerce providers can capture a large portion of the market by catering to regional needs (language, local logistics), even as global platforms are available.
Iceland 🇮🇸
Iceland’s e-commerce sector is the smallest in this group - we identified roughly 1,712 online stores in Iceland. Interestingly, Shopify absolutely dominates this tiny market. Approximately 1,169 Icelandic webshops run on Shopify, which is about 68% of all online stores in the country. This is one of the highest national market shares for Shopify among the countries examined. WooCommerce is the second most common, with around 507 stores (~30%).
Combined, Shopify and WooCommerce account for an astonishing ~98% of Iceland’s e-commerce sites - essentially a duopoly. This leaves very little room for other platforms: the third-place contender (far behind) is Magento, with only about 16 identified sites (<1%). A handful of stores use OpenCart (a dozen sites) or PrestaShop (just 4 sites).
The overwhelming preference for Shopify in Iceland could be due to the lack of any local e-commerce solution and the appeal of an easy-to-deploy, cloud-based platform for a small market. Additionally, many Icelandic businesses likely cater to international audiences or use English online, making a globally-oriented platform like Shopify a natural choice.
In summary, Iceland’s platform landscape is an outlier: Shopify is nearly synonymous with e-commerce here, with WooCommerce capturing most of the remainder and virtually no other platform having any significant footprint.
Italy 🇮🇹
Italy has an estimated 72,334 active webshops in this analysis. The Italian e-commerce platform distribution skews heavily towards WooCommerce. WooCommerce is used by roughly 39,852 Italian online stores, about 55% of the total. This aligns with WooCommerce’s popularity among small-to-medium businesses in many European countries. Shopify is the second most used platform in Italy, powering about 17,804 stores (~24-25% share). Together, WooCommerce and Shopify make up nearly 80% of Italy’s e-commerce sites.
In third place is PrestaShop, which has a strong user base in Italy (around 6,349 stores, roughly 9% share). PrestaShop’s open-source platform, originally from France.. Beyond the top three, no single platform has more than a single-digit percentage of share. Custom-built solutions account for around 2-3% (we identified ~2,061 custom sites) indicating some companies opt for fully bespoke stores.
Magento, once a leading platform for mid-sized and enterprise merchants, now powers only about 1,938 Italian stores (~2.7%) - showing a decline in relative popularity as easier solutions have gained ground. Other platforms in Italy include smaller counts of OpenCart, Wix (for simpler websites with stores), and local SaaS offerings (though none of the local Italian platforms stand out in the data - the market seems largely served by international or open-source solutions).
In summary, Italy leans strongly on WooCommerce for a majority of shops, with Shopify as a robust second choice and PrestaShop still holding a notable third-place share. This suggests a mix of merchants: many favoring WooCommerce for its low cost and WordPress integration, and a significant group opting for Shopify’s simplicity, while an older guard or specific segment continues with PrestaShop and Magento.
Lithuania 🇱🇹
Lithuania’s e-commerce market, with about 14,604 webshops, also shows a strong preference for WooCommerce. Around 7,983 Lithuanian online stores (about 55%) are built on WooCommerce, making it the dominant platform by far. Shopify is the second most popular, used by roughly 2,734 stores (~19% share). Combined, these two make up roughly 74% of the Lithuanian market, similar to other countries.
However, Lithuania has a more notable third-place presence than some others: PrestaShop powers about 1,706 stores (~12% of the market). In fact, PrestaShop is not far behind Shopify here - 12% vs 18% - showing that PrestaShop remains a viable choice for many Lithuanian merchants.
After PrestaShop, the remaining ~15% of sites are on a mix of platforms. OpenCart is fairly common (around 1,052 stores, ~7%) and there is a long tail of small platforms and custom sites. Notably, two Lithuanian-developed e-commerce platforms, Shopiteka and Verskis, appear in the data - but they rank among the smaller players, together accounting for only a couple hundred stores. For instance, Verskis is used by fewer than 100 sites (only ~96 identified), and Shopiteka similarly under 100. This indicates that, unlike some other Eastern European markets, local Lithuanian solutions haven’t achieved high popularity against the global and open-source options.
Overall, Lithuanian e-commerce is heavily reliant on WooCommerce’s ecosystem, with a significant minority on Shopify and a continued loyal user base on PrestaShop - reflecting perhaps the influence of neighboring Poland/Europe where PrestaShop is stronger, and the needs of merchants who prefer an open-source but more standalone platform than WooCommerce.
Latvia 🇱🇻
Latvia has approximately 6,049 online stores in the database. The platform distribution in Latvia is a bit more balanced at the top than in Lithuania or Estonia, but WooCommerce still leads. Around 1,841 Latvian webshops use WooCommerce, making up about 37% of the market. Shopify is the second most common at about 1,201 stores (~24% share). Together, they account for roughly 61% of Latvian online shops.
The remaining 39% is divided among various other platforms. One notable aspect of Latvia is the significant use of other solutions: OpenCart is the third-largest platform with roughly 713 sites (~12%) based on our data. Following that, a considerable number of sites are custom-built (~471 sites, ~8%), indicating a chunk of merchants opt for tailor-made solutions. PrestaShop comes next with about 333 stores (~5.5%).
Latvia also has its own local website builder/e-commerce tool named Mozello, which appears to power around 270 stores (around 4-5% of the market) - a non-trivial share for a local platform. Mozello offers easy bilingual site creation (useful in Latvia’s multilingual environment), which might explain its uptake.
All other platforms (Magento, Ecwid, etc.) each account for only a few percent or less. The data suggests that while WooCommerce and Shopify are very important in Latvia, a large minority of merchants use a mix of open-source, custom, or regional tools, making it a more diverse platform ecosystem in relative terms (nearly 40% using “other” platforms beyond the big two).
Netherlands 🇳🇱
The Netherlands boasts a highly developed e-commerce market, with about 112,906 webshops counted in this analysis. Dutch online retailers have a clear favourite: WooCommerce. We found roughly 38,316 Dutch webshops using WooCommerce, which is about 46% of all online shops in the Netherlands. This aligns with other findings that WooCommerce has a very strong presence in the Dutch market. Shopify is the second-largest platform with around 21,534 stores (~26% share). Together, WooCommerce and Shopify account for approximately 72% of the market, leaving just over a quarter of sites on other platforms.
The Netherlands has a diverse mix of other e-commerce solutions making up that remaining ~27%. One notable player is Optimizely (formerly Episerver Commerce), an enterprise-level platform - about 7,928 Dutch sites (~7%) use Optimizely. This is a significant share and suggests many mid-to-large Dutch businesses invest in enterprise .NET-based solutions (possibly thanks to a robust ecosystem of agencies for Optimizely in the region).
Magento is also present, with around 6,176 sites (~5.5%). The Dutch market also continues to support Lightspeed (formerly SEOshop in Europe) with roughly 3,820 sites (~3.4%). Lightspeed’s continued use is expected given its local origins and focus on omnichannel retailers (brick-and-mortar stores integrating online). Additionally, a homegrown platform MyOnlineStore (also known as JouwWeb) powers about 3,600 shops (a little over 3%). Other platforms in the Netherlands include PrestaShop, Wix, Shopware, and custom builds, but each of those represents only 2-3% or less.
The key takeaway is that the Dutch e-commerce environment is heavily weighted toward WooCommerce for smaller businesses and content-driven stores, with Shopify catching up for pure-play online merchants, while a substantial segment of more complex or established retailers opt for enterprise or locally tailored solutions like Optimizely and Lightspeed.
Norway 🇳🇴
Norway’s e-commerce market includes around 17,316 webshops. The competition between WooCommerce and Shopify is particularly tight in Norway. WooCommerce is used by roughly 5,346 Norwegian webshops (39% share). Shopify is a very close second with about 4,931 sites (36% share). That’s a gap of only a few hundred sites, or about 3 percentage points, in WooCommerce’s favour. This near parity shows how strongly Shopify has gained traction even in markets traditionally dominated by open-source solutions.
The remaining ~24% of Norwegian webshops (about 3,192 sites) run on various other providers. Norway has a couple of notable local platforms in this “others” category. MyStore, a Norwegian-founded e-commerce platform, is the third most popular choice with about 1,071 sites (~6% share). MyStore’s presence indicates that some Norwegian merchants prefer a domestic solution, possibly for its local language support and integration with Norwegian payment or logistics options. Another Norwegian platform 24Nettbutikk accounts for around 701 sites (~4%), making it the fourth-ranked platform.
After these, the rest is fragmented: Magento has a few hundred sites (~2.7%), and there are many small contributions from others like Wix, WooCommerce’s forked variants, etc. The Norwegian e-commerce platform landscape can be summarized as a neck-and-neck race between the top global two, with local players carving out around 10% of the market combined (not insignificant for a country of Norway’s size). The close competition also suggests that platform choice in Norway might come down to specific business preferences - WooCommerce for content flexibility or existing WordPress usage, versus Shopify for ease of use - rather than clear-cut market leader advantage.
Romania 🇷🇴
Romania’s e-commerce market (approximately 31,892 webshops) shows a strong lead for WooCommerce as well, with some influence of local platforms. WooCommerce is estimated to power about 17,262 Romanian online stores, which is roughly 54% of the total. This is a majority share, indicating WooCommerce’s popularity among Romanian merchants, likely due to its low cost and flexibility in a price-sensitive market. The second most popular platform is Shopify, used by around 5,396 stores (~17%). Shopify’s share in Romania, while significant, is lower than in many Western countries.
The third place goes to PrestaShop with roughly 2,327 stores (~7%). PrestaShop has a community in Romania (the platform’s multilingual support and open source nature align well with local developer communities). Close behind, OpenCart is the fourth most used, powering around 2,179 stores (~6.8%). OpenCart has been historically popular in Eastern Europe for its simplicity.
Importantly, Romania has a couple of homegrown e-commerce solutions that make the top-five list. Gomag, a Romanian e-commerce SaaS platform, is used by about 1,773 stores (~5.6%). Another local platform, MerchantPro (formerly ShopMania BIZ), appears with a few hundred stores (~896 identified, ~3%). These local providers offer Romanian-language interfaces and local payment/shipping integrations, which can attract merchants. While Gomag’s share is notable, it still trails far behind WooCommerce.
The remaining portion of the Romanian market includes Magento (~828 sites, ~2.6%), along with other small players (including some regional ones like OpenCart as mentioned, and possibly osCommerce and Oxid with tiny footprints). The trend in Romania is that WooCommerce overwhelmingly dominates, with Shopify being the main international alternative, but local e-commerce service providers like Gomag have carved out respectable niches by addressing country-specific needs.
Sweden 🇸🇪
Sweden has a robust e-commerce sector with about 38,965 webshops. The Swedish platform distribution looks somewhat similar to Norway’s. WooCommerce holds the lead with roughly 13,293 sites (~39% of Swedish webshops). Shopify is not far behind at about 11,354 sites (around 34% share). The difference between them is only about 5% of the market (~2,000 stores), indicating a close contest in Sweden as well. Combined, these two account for roughly 73% of Swedish online stores.
The remaining 26-27% use other platforms. One noteworthy local platform in Sweden is Quickbutik, which is the third most popular solution with about 2,809 sites (~7.2%). Quickbutik is a Swedish e-commerce platform geared toward small businesses, and its ~7% share shows a significant minority of merchants opt for it, possibly for its simplicity and Swedish-language support. Another local contender is Wikinggruppen (part of Visma), which appears with a few hundred stores (~528 identified, around 1.4%).
Sweden also has a relatively higher incidence of custom-built stores - around 1,151 custom e-commerce sites (~3.0%) were noted, which could include large retailers and boutiques with bespoke solutions. Magento is used by around 932 sites (~2.4%), and PrestaShop by a similar number (~728 sites, ~1.9%). Additionally, Wix and Squarespace (general website builders with commerce capabilities) together account for a few percent (Wix around 480 sites, for instance).
In summary, Sweden’s e-commerce platforms are dominated by the top global two, but a healthy ecosystem of local services like Quickbutik and other specialized platforms thrives in the shadow of those giants. The competition between WooCommerce and Shopify in Sweden is intense - only a 4% market share difference - showing that Swedish merchants are split between the convenience of Shopify and the flexibility of WooCommerce, with neither running away completely with the market.
Slovakia 🇸🇰
Slovakia, with around 17,616 online stores, presents an interesting case where a regional platform plays a major role. WooCommerce is still number one at roughly 7,144 Slovakian webshops (about 41% of the market). However, unlike most countries where Shopify is the automatic second, in Slovakia the second-place platform is Shoptet with about 3,502 webshops (~20-22% share). Shoptet is a Czech-based e-commerce platform very popular in Central Europe, and its strong showing in Slovakia (over a fifth of Slovak webshops) is testament to that regional influence.
Shopify, by contrast, is less prevalent - it actually ranks fourth in Slovakia. The third spot belongs to PrestaShop (~1,309 stores, ~7%) and Shopify comes in fourth with around 1,183 stores (~6.7%).
The remaining ~25% of Slovak stores are split among other providers. After Shopify, OpenCart accounts for roughly 800 stores (~4.5%). There are also a couple of local Slovak/Czech solutions further down: for example, Webareal (~727 stores) and eShop Rýchlo (eShop Rychle) (~529 stores) each have a small share. Upgates, another Czech platform, appears with a few hundred Slovak shops as well. The key insight for Slovakia is that regional integration matters - Shoptet’s platform offers integrations to Central European marketplaces and local services, which has made it more popular than even Shopify for Slovak merchants. This is a reminder that in certain markets, being attuned to local commerce ecosystems (language, marketplaces like Heureka or Alza, local payment gateways) can give a platform a significant edge. WooCommerce still leads thanks to its general appeal and flexibility, but Shoptet’s high adoption shows that merchants will embrace a solution that caters to their regional business needs, even if a global option is available.
Trends and Takeaways
Looking across all these countries, a few clear trends emerge.
1. WooCommerce and Shopify dominate the European e-commerce platform market.
In virtually every country analyzed, these two platforms account for well over half (often around 70% or more) of all online stores. WooCommerce tends to lead in markets with strong DIY or open-source communities, while Shopify often gains in markets where turn-key solutions are in demand. Their combined dominance poses a high barrier to entry for any new platforms - unseating either would require not just converting a few merchants, but a massive migration that seems unlikely unless a radically better value proposition comes along.
2. Local and regional platforms still matter, especially in certain countries.
We see this clearly in places like Hungary (Unas, Shoprenter), Norway (MyStore, 24Nettbutikk), Finland (MyCashFlow), Czechia/Slovakia (Shoptet, Webareal), and Romania (Gomag, MerchantPro). These platforms succeed by catering to local languages, regulations, and business practices, offering features or integrations out-of-the-box that global platforms might not handle as smoothly (for example, integration with local marketplaces, tax rules, or popular domestic payment methods).
While none of these local providers comes close to dethroning the top two in absolute numbers, they often secure a solid third-place position - sometimes even second, as Shoptet does in Slovakia - capturing anywhere from 5% to 25% of their home market. This indicates an industry fit advantage: in specific niches or regions, a tailored solution can beat a one-size-fits-all global platform. For e-commerce leaders, this means it’s important to be aware of and integrated with local platforms when operating in those markets, as they may have a loyal user base.
3. Open-source vs. SaaS dynamics
The data reflects a broader shift from open-source, self-hosted carts (like Magento, PrestaShop, OpenCart) toward SaaS and cloud-hosted solutions (like Shopify, and to an extent local SaaS like Shoprenter or Shoptet).
A decade ago, platforms like Magento and PrestaShop were among the top choices in Europe. Today, Magento powers only a small percentage of stores in these countries (generally 2-5%), and PrestaShop, while still significant in some markets (up to ~12% in Lithuania, ~9% in Italy), is far behind the leaders. This doesn’t mean these platforms are disappearing - indeed, Magento remains a top choice for many high-traffic and complex stores (often enterprise B2C or B2B, where its scalability and customization shine, even if the count of Magento stores is low) (mgt-commerce.commgt-commerce.com).
PrestaShop similarly maintains a strong community among mid-sized merchants who prefer open source. However, the growth seems to be with easier-to-deploy, maintenance-free solutions. Shopify’s growth is evident across Europe, even in traditionally resistant markets like Germany (where it reportedly grew its market share 35% since 2018 to take the lead (cedcommerce.com). WooCommerce, while open-source, benefits from being a plugin to WordPress - thus riding the coattails of the world’s most popular CMS - and remains accessible to non-developers via hosting providers and one-click installs, keeping it competitive in the era of SaaS.
4. Platform capabilities and industry fit
Different platforms tend to appeal to different segments of the market:
WooCommerce is favored by content-driven businesses (who already use WordPress) and smaller merchants who want full control with minimal cost. It’s highly flexible with plugins, but requires more hands-on management. The data shows WooCommerce having especially high shares in countries with strong WordPress usage and developer communities (e.g., Estonia, Italy, Netherlands).
Shopify appeals to merchants who prioritize ease of use, reliable hosting, and a rich app ecosystem without needing technical know-how. Its surge in countries like Germany and Iceland underscores how a user-friendly, all-in-one solution can rapidly gain trust, even in markets that once prized self-hosted solutions (cedcommerce.com). Shopify is also increasingly capable of serving larger merchants (Shopify Plus), which may further grow its share among enterprises.
PrestaShop and OpenCart still appeal to budget-conscious or technically oriented merchants, especially in Eastern and Southern Europe, who want an open-source store but perhaps find Magento too heavy. These platforms are often used for small-to-mid shops that need specific customizations and local hosting. Their share is shrinking in many places, but they remain part of the mix (often in the 5-15% range in various countries).
Magento (Adobe Commerce) has shifted to an enterprise focus. The relatively low count of Magento stores hides the fact that many larger retailers and B2B wholesalers run on Magento for its advanced features and scalability. For example, Magento is estimated to hold about an 18% share of Europe’s e-commerce revenue or enterprise usage (though only a few percent of the count of stores) (mgt-commerce.commgt-commerce.com). It remains strong in specific sectors like fashion and auto parts in Europe, where its robustness and the availability of skilled Magento developers are valued.
Local platforms often differentiate through localized capabilities: e.g., Shoptet’s integration with Central European marketplaces, MyCashFlow’s understanding of Finnish payment systems, or Dandomain’s tie-ins with Danish ERP software. Industry-wise, some local platforms cater to certain industries (for instance, Lightspeed’s strength among restaurants and brick-and-mortar retail with its POS integration). Quickbutik in Sweden markets itself to boutique retailers. These platforms might not scale globally, but they fit the industry and regional needs of their target users extremely well, ensuring their survival amid global competition.
5. Growth trajectories
The overall trend is a consolidation toward a few major platforms (especially Shopify and WooCommerce). Shopify’s aggressive growth is a common thread - it’s growing its share in essentially every market, often at the expense of older local solutions or smaller platforms. WooCommerce also continues to grow in absolute terms (the number of WooCommerce stores is rising), though its market share in some places is plateauing or falling slightly where Shopify gains. Platforms like Magento and PrestaShop, while still gaining new sites, are growing much slower or even declining in share as merchants replatform to easier solutions. Local platforms show mixed trends: some are growing (e.g., Shoptet’s expansion from Czech into Slovakia, or Gomag in Romania attracting sellers moving online), while others may be slowly losing ground if they can’t match the features or marketing of the global competitors. For example, the data for Germany implies platforms like Shopware and JTL, despite being robust, have ceded the #1 spot to Shopify and may need to innovate to maintain relevance.
In conclusion, understanding which e-commerce platforms dominate in each country is valuable for anyone in the e-commerce industry. If you’re a technology or service provider, these insights help in estimating your total addressable market on each platform and prioritizing integrations - for instance, focusing on WooCommerce and Shopify covers ~70% of shops off the bat, but if you target a country like Hungary or Slovakia, you’d miss a large chunk if you ignore local platforms. For e-commerce merchants or investors, knowing the popular platforms can guide you toward the solutions with the strongest local ecosystems (developers, agencies, plug-ins) in a given region.
Despite the pan-European dominance of WooCommerce and Shopify, the diversity of platforms in the remaining share is a reminder that one size does not fit all. Each market has its nuances, and platforms that align with local languages, regulations, cross-border possibilities or industry niches can capture significant share. As the e-commerce sector continues to grow and evolve, keeping an eye on platform popularity and trends in each country can provide a strategic advantage - whether that’s choosing a platform for your next webshop or deciding which markets to expand platform-specific services into. The data confirms a broad trend toward a few leading frameworks, but also highlights where opportunities lie in serving the ecosystems around the myriad of other platforms that together still power tens of thousands of European webshops.
Sources: The platform usage data is derived from a 2025 analysis of hundreds of thousands of European webshops (Tembi Market Intelligence and other sources). Additional context on regional platforms and market shares was taken from industry reports and studies. Each country section above cites specific data sources.
Across Europe, the last-mile delivery landscape is rapidly evolving, driven by consumer preferences, sustainability pressures, and regulatory changes. Recent data from delivery providers, postal services, and consumer surveys across 13 European countries - Sweden, Denmark, Finland, Norway, Italy, the Netherlands, Slovakia, Latvia, Lithuania, Estonia, Hungary, Bulgaria, and Romania - reveals distinct regional patterns in how online purchases reach consumers.
A recent analysis from our e-commerce database, based on data from over 140,000 webshops across these countries, provides deeper insights into how extensively online retailers offer different delivery methods.

Nordic markets lead with out-of-home delivery
Nordic countries have strongly adopted out-of-home (OOH) delivery methods, including parcel shops and lockers. Sweden traditionally favours parcel shops, with Tembi’s data showing 36.1% of Swedish webshops offering this method. Denmark stands out with parcel shop deliveries offered by 57.6% of webshops, reflecting extensive and convenient networks.
Finland is a leader in parcel locker adoption - 34.1% of Finnish webshops offer locker delivery, supported by a widespread network of accessible 24/7 lockers. Norway balances between home (52.1% of webshops) and parcel shop deliveries (33%), with locker installations growing at 9%, indicating increasing preference for flexible, automated solutions.
Parcel lockers thrive in the Baltics
Estonia, Latvia, and Lithuania showcase exceptional acceptance of parcel lockers. In Estonia, a remarkable 71.8% of webshops offer parcel lockers, validating Estonia’s leadership in locker infrastructure. Lithuania and Latvia follow closely, with 66.4% and 54.7% respectively offering parcel lockers, strongly supporting consumer preferences for convenience and reduced environmental impact.
Mixed preferences in Western Europe
In Western Europe, the Netherlands strongly prefers collect-yourself options, with Tembi data showing 76.4% of Dutch webshops offer this method. Home delivery remains prevalent, offered by 27.5% of retailers, aligning with the Dutch consumer's primary preference for doorstep delivery but complemented significantly by collect-yourself options.
Italy, traditionally a home-delivery market, now shows a strong adoption of collect-yourself options, offered by 64.9% of Italian webshops. Out-of-home delivery is now Italy's second most popular delivery option after home delivery, driven by convenience and reliability.
Rising OOH and workplace delivery in Central and Eastern Europe
Eastern European markets like Slovakia, Hungary, Romania, and Bulgaria traditionally favoured home delivery but now rapidly integrate OOH options. Slovakia prominently features home delivery (76.9%) but also offers parcel shops through 42.9% of webshops, echoing the region's evolving preferences.
Hungary continues to favour home delivery significantly (82.6%), but parcel lockers have rapidly expanded, with about 37.7% of webshops offering this method. Romania, while strongly home-delivery oriented (83.9%), sees parcel lockers emerging as supplementary (21.2%).
Bulgaria uniquely highlights workplace delivery, offered by 36.2% of online retailers, underscoring its importance in urban logistics. This method provides practical advantages in urban areas where home deliveries may face reliability challenges.
Regulatory push towards sustainable delivery
Belgium recently mandated online retailers offer at least two delivery options at checkout, including one eco-friendly alternative such as parcel shops or lockers. Effective from 2024, this regulation aims to reduce failed deliveries, lower emissions, and encourage sustainable consumer choices (bpost, 2024). This legislative move sets a precedent that other European countries might soon follow.
Sustainability and infrastructure implications
Parcel lockers and out-of-home delivery significantly reduce last-mile delivery emissions, potentially cutting CO₂ by approximately 30% compared to home delivery, especially when consumers collect parcels using sustainable transport methods (McKinsey, 2024). Dense networks of lockers and collection points, common in Estonia, Finland, and the Netherlands, enhance urban delivery efficiency, reduce traffic congestion, and improve consumer satisfaction.
Future outlook
European last-mile delivery is undeniably trending towards flexible, sustainable methods that reflect varied regional consumer behaviours. As OOH options mature and consumer awareness grows, home delivery will increasingly coexist with alternative methods. Carriers and retailers who proactively adapt will lead in delivering not just parcels, but also consumer satisfaction and sustainability.
Sources
- Tembi Webshop Delivery Method Analysis.
- PostNord E-commerce in the Nordics
- Statista Parcel Delivery Trends in Denmark
- Posti Parcel Locker Usage in Finland
- Bring Delivery Preferences in Norway.
- Omniva Parcel Locker Popularity in Estonia
- Thuiswinkel.org Dutch E-commerce Delivery Preferences
- DPDgroup European E-shopper Barometer
- Packeta Delivery Trends in Slovakia
- Speedy Delivery Methods in Bulgaria
- bpost Belgium’s Two-Option Delivery Mandate
- McKinsey Sustainability in Last-Mile Delivery
Across Europe, the last-mile delivery landscape is rapidly evolving, driven by consumer preferences, sustainability pressures, and regulatory changes. Recent data from delivery providers, postal services, and consumer surveys across 13 European countries - Sweden, Denmark, Finland, Norway, Italy, the Netherlands, Slovakia, Latvia, Lithuania, Estonia, Hungary, Bulgaria, and Romania - reveals distinct regional patterns in how online purchases reach consumers.
A recent analysis from our e-commerce database, based on data from over 140,000 webshops across these countries, provides deeper insights into how extensively online retailers offer different delivery methods.
Nordic markets lead with out-of-home delivery
Nordic countries have strongly adopted out-of-home (OOH) delivery methods, including parcel shops and lockers. Sweden traditionally favours parcel shops, with Tembi’s data showing 36.1% of Swedish webshops offering this method. Denmark stands out with parcel shop deliveries offered by 57.6% of webshops, reflecting extensive and convenient networks.
Finland is a leader in parcel locker adoption - 34.1% of Finnish webshops offer locker delivery, supported by a widespread network of accessible 24/7 lockers. Norway balances between home (52.1% of webshops) and parcel shop deliveries (33%), with locker installations growing at 9%, indicating increasing preference for flexible, automated solutions.
Parcel lockers thrive in the Baltics
Estonia, Latvia, and Lithuania showcase exceptional acceptance of parcel lockers. In Estonia, a remarkable 71.8% of webshops offer parcel lockers, validating Estonia’s leadership in locker infrastructure. Lithuania and Latvia follow closely, with 66.4% and 54.7% respectively offering parcel lockers, strongly supporting consumer preferences for convenience and reduced environmental impact.
Mixed preferences in Western Europe
In Western Europe, the Netherlands strongly prefers collect-yourself options, with Tembi data showing 76.4% of Dutch webshops offer this method. Home delivery remains prevalent, offered by 27.5% of retailers, aligning with the Dutch consumer's primary preference for doorstep delivery but complemented significantly by collect-yourself options.
Italy, traditionally a home-delivery market, now shows a strong adoption of collect-yourself options, offered by 64.9% of Italian webshops. Out-of-home delivery is now Italy's second most popular delivery option after home delivery, driven by convenience and reliability.
Rising OOH and workplace delivery in Central and Eastern Europe
Eastern European markets like Slovakia, Hungary, Romania, and Bulgaria traditionally favoured home delivery but now rapidly integrate OOH options. Slovakia prominently features home delivery (76.9%) but also offers parcel shops through 42.9% of webshops, echoing the region's evolving preferences.
Hungary continues to favour home delivery significantly (82.6%), but parcel lockers have rapidly expanded, with about 37.7% of webshops offering this method. Romania, while strongly home-delivery oriented (83.9%), sees parcel lockers emerging as supplementary (21.2%).
Bulgaria uniquely highlights workplace delivery, offered by 36.2% of online retailers, underscoring its importance in urban logistics. This method provides practical advantages in urban areas where home deliveries may face reliability challenges.
Regulatory push towards sustainable delivery
Belgium recently mandated online retailers offer at least two delivery options at checkout, including one eco-friendly alternative such as parcel shops or lockers. Effective from 2024, this regulation aims to reduce failed deliveries, lower emissions, and encourage sustainable consumer choices (bpost, 2024). This legislative move sets a precedent that other European countries might soon follow.
Sustainability and infrastructure implications
Parcel lockers and out-of-home delivery significantly reduce last-mile delivery emissions, potentially cutting CO₂ by approximately 30% compared to home delivery, especially when consumers collect parcels using sustainable transport methods (McKinsey, 2024). Dense networks of lockers and collection points, common in Estonia, Finland, and the Netherlands, enhance urban delivery efficiency, reduce traffic congestion, and improve consumer satisfaction.
Future outlook
European last-mile delivery is undeniably trending towards flexible, sustainable methods that reflect varied regional consumer behaviours. As OOH options mature and consumer awareness grows, home delivery will increasingly coexist with alternative methods. Carriers and retailers who proactively adapt will lead in delivering not just parcels, but also consumer satisfaction and sustainability.
Sources
- Tembi Webshop Delivery Method Analysis.
- PostNord E-commerce in the Nordics
- Statista Parcel Delivery Trends in Denmark
- Posti Parcel Locker Usage in Finland
- Bring Delivery Preferences in Norway.
- Omniva Parcel Locker Popularity in Estonia
- Thuiswinkel.org Dutch E-commerce Delivery Preferences
- DPDgroup European E-shopper Barometer
- Packeta Delivery Trends in Slovakia
- Speedy Delivery Methods in Bulgaria
- bpost Belgium’s Two-Option Delivery Mandate
- McKinsey Sustainability in Last-Mile Delivery
Cross-border online sales are an important growth channel for webshops in Europe’s integrated market. This article examines why certain international sales corridors dominate for e-commerce merchants in five European countries – the Netherlands, Germany, Denmark, Italy, and Sweden. We analyse the top export markets of webshops in each country (based on provided top-10 destination data) and explore the factors behind these patterns, including geography, language, economic ties, consumer behaviour, and logistics integration. We also benchmark the maturity of each country’s e-commerce sector (webshop density and online-selling share).The goal is to provide European e-commerce professionals with insight into existing cross-border flows and how to leverage them.
Cross-border corridors and drivers by country
Netherlands: Neighbours, shared language and trade hub reach
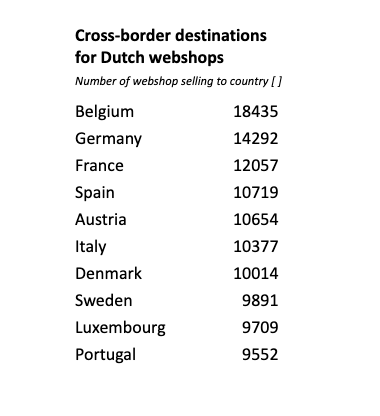
Dutch webshops are remarkably outward-looking, with nearby Belgium and Germany as the top destinations for online exports. Belgium tops the list (a large portion of Dutch cross-border orders), thanks in part to shared language (Dutch is spoken in Flanders) and immediate proximity facilitating quick shipping. Likewise, Germany – Europe’s largest e-commerce market – is a close neighbor and a natural target for Dutch retailers. Geographic centrality and excellent logistics infrastructure in the Netherlands (Rotterdam port, Schiphol airport) make it a hub for distributing goods across Western Europe, so Dutch webshops easily serve France, Spain, and Italy as well (ecommercegermany.com). Many Dutch merchants localise in English or multiple languages, leveraging the population’s high foreign language proficiency. These factors, combined with the Netherlands’ high Internet penetration and consumer spending, explain why Dutch online sellers extend their reach broadly into Europe. The cross-border focus is diverse, but the Benelux and adjacent EU markets dominate Dutch e-commerce exports.
Germany: A giant at home with strong neighbour links

German webshops tend to have a more regional cross-border focus, reflecting Germany’s huge domestic market which somewhat lessens reliance on exports. Nevertheless, German retailers mainly ship to German-speaking neighbours, especially Austria (the top export market) and Switzerland, as well as the Benelux countries (ecdb.com). Austria’s shared German language and culture make it a natural extension of the domestic market, and indeed over half of Austria’s cross-border e-shopping is from Germany (ecdb.com), illustrating this tight linkage. Similarly, a high share of Luxembourg’s online imports come from German sites (ecdb.com), aligning with Germany listing Luxembourg among its top export destinations. Beyond these, German e-sellers target large EU economies like France, Italy and Spain, but volumes there are lower relative to Germany’s size. Geographic proximity and EU single-market ties play a key role – Germany’s neighbours (Austria, Netherlands, France, Poland, Denmark, etc.) comprise most of its top 10 export markets. While Germany has the most e-commerce sales in Europe, its cross-border activity (in percentage terms) is more modest than smaller countries’, as its home market is very self-sufficient. Still, German webshops capitalise on being in the center of Europe by serving nearby countries with minimal barriers.
Denmark: Nordic integration and broader EU outreach
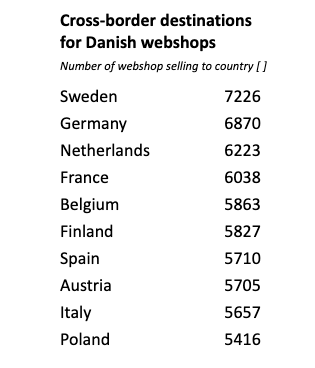
Denmark’s online retailers are highly oriented toward Nordic and nearby EU markets. The top export destination is Sweden, Denmark’s neighbour across the Øresund bridge, reflecting strong regional integration. Danish merchants benefit from cultural and linguistic affinities within Scandinavia (Danish and Swedish are mutually intelligible to a degree), and importantly from a merged postal network (PostNord) that eases Denmark–Sweden deliveries. Germany is the second-most common destination for Danish webshops – a logical outcome of geographic adjacency and Germany’s market size. Other top targets include the Netherlands, France, and Belgium, indicating Danish online retailers don’t confine themselves to Scandinavia. High English proficiency in Denmark and use of international e-commerce platforms enable even small Danish webshops to sell into distant European markets. Finland and Norway also appear in Danish sellers’ top corridors, consistent with a Nordic e-commerce cluster. In sum, proximity and regional ties drive much of Denmark’s cross-border trade, but Danish companies’ agility and the necessity to grow beyond a small domestic market push them to court major economies across Europe as well.
Sweden: Regional strength and EU market access

Swedish webshops likewise show a strong Nordic focus coupled with EU-wide reach. Denmark and Finland rank among the top export markets for Sweden’s online retailers, owing to Sweden’s position bridging Nordic neighbours (and sharing a land border with Finland). Cross-border commerce within the Nordics is bolstered by relatively aligned consumer habits and the prevalence of English, though language differences (Swedish vs. Finnish) still pose some barrier. Sweden’s list of top e-commerce export destinations also features Germany, the Netherlands, France, Spain, and Belgium, mirroring a broad Western European outreach similar to Denmark’s. Sweden’s e-merchants benefit from being in one of Europe’s most digitally mature societies, and they leverage efficient logistics links (for example, ferry routes and international carriers) to serve far-flung customers. Still, the easiest wins are nearby: Denmark alone accounts for a significant share of Swedish cross-border online sales, exemplifying how regional integration (e.g. PostNord’s bi-national network) underpins cross-border e-commerce in Scandinavia.
Italy: Big EU partners and niche appeal abroad

Italian webshops, operating in a large but traditionally less digitized market, concentrate their cross-border sales on Europe’s biggest economies and nearby countries. Germany is the number-one export destination for Italian online sellers by volume, followed closely by France and Spain, which together account for a large majority of Italy’s e-commerce exports (amavat.eu). This reflects both geographic proximity (France and Austria border Italy, and Germany is just beyond the Alps) and strong demand for Italian products (e.g. fashion, design, food) in wealthier EU markets. Austria is another key corridor (benefiting from adjacency and a shared German-language business environment), and neighbors Switzerland and Slovenia (not in the top-ten list provided, but likely significant) also draw Italian exports. Interestingly, Northern European markets like the Netherlands, Belgium, Denmark, Sweden and Poland appear among Italy’s top export destinations as well – indicating that Italian brands have appeal across Europe despite distance. Italy’s cross-border e-commerce has been surging in recent years, growing its share of total online turnover from ~29% to 39% between 2019 and 2022 (amavat.eu). However, Italian webshops are relatively fewer per capita, so much of this cross-border activity is driven by a subset of competitive firms (often via marketplaces). In summary, Italy’s e-commerce exports gravitate toward large EU consumer markets and nearby neighbors, leveraging Italy’s renowned products, even as the domestic e-commerce sector catches up in maturity.
Similarities and differences in cross-border focus
Despite national nuances, these five countries share some common patterns. Neighboring countries dominate cross-border e-commerce flows in many cases – a classic gravity effect where shorter distances, lower shipping costs, and familiar cultures facilitate trade. For example, the Netherlands-Belgium, Germany-Austria, and Denmark-Sweden corridors are all top-ranked, underscoring the importance of geographic proximity and shared language or cultural ties. This aligns with research finding that even online, distance and cultural/language factors still significantly impact trade (though less than offline) (econstor.eu). Additionally, all five nations see major EU economies (Germany, France, Spain) in their export mix. These large markets are attractive targets due to their sheer number of online shoppers – Germany and France are among Europe’s top destinations for cross-border e-commerce imports (ecommercegermany.com). In fact, German consumers are so pivotal that every country’s webshops list Germany as a top-3 foreign market (except Germany itself), and German shoppers account for a sizeable share of many neighbour's’ online sales (ecdb.com).
However, there are clear differences in scope. The smaller, digitally advanced countries (Netherlands, Denmark, Sweden) tend to export to a broader array of markets across Europe, reflecting their need to go global to scale beyond limited domestic populations. Their top-10 lists include more distant EU distinations – enabled by strong English usage and pan-European platforms. In contrast, Germany and Italy (the larger markets) show a relatively more regional focus, concentrating on immediate neighbors and a few key economies. German webshops’ cross-border sales are more regionalized (e.g. mostly EU neighbors), and Italy’s exports tilt heavily to Western Europe (with limited Nordic focus). Another difference is the reciprocity of corridors: e.g. Denmark and Sweden mutually rank each other very high, whereas Italy and Germany have an asymmetry (Italy relies on Germany more than Germany on Italy). This hints at differing product specializations and consumer preferences driving flows one way more than the other. Finally, language plays a part – shared language pairs (Dutch-Flemish, German-Austrian, Scandinavian languages) clearly boost mutual e-commerce, whereas language barriers can limit cross-border reach unless sellers localise (which not all Italian or German SMEs do as readily as Nordics). Overall, all five countries leverage the borderless EU market, but the extent of their reach and the partners they prioritize vary with their size, culture, and e-commerce sophistication.
E-Commerce maturity benchmark
The strength of a country’s e-commerce sector underpins its cross-border capabilities. Two useful indicators are the number of webshops per capita and the share of companies engaging in online sales. Below is a brief benchmark of the five countries:
- Denmark: ~40,700 webshops for 5.9 million people – roughly 6.9 webshops per 1,000 inhabitants, one of the highest densities in Europe. Around 7.3% of all Danish companies sell online, indicating a very mature digital commerce environment (many firms extend sales to the web). This high density provides Denmark with a rich base of exporters, from niche boutiques to large players.
- Netherlands: ~119,600 webshops on a population of 18 million gives about 6.6 webshops per 1,000 people nearly on par with Denmark’s density. Approximately 6.2% of Dutch companies sell online, making the Netherlands another leader in e-commerce maturity. A combination of scale and density (a large number of stores relative to population) means Dutch e-retailers are both numerous and often well-optimised for international sales.
- Sweden: ~40,500 webshops for 10.6 million people – about 3.8 per 1,000 people, which is a good density but lower than the Dutch/Danish level. Roughly 3.5% of Swedish companies engage in e-commerce. Sweden’s e-commerce is well-established on the consumer side (nearly half of online shoppers buy cross-border (trade.gov)), but the proportion of businesses running webshops, while solid, is moderate compared to the Benelux or Nordics leaders.
- Germany: ~134,400 webshops serving 83.2 million people yields only 1.6 webshops per 1,000 inhabitants, a comparatively low webshop density given Germany’s vast population (tembi.io). About 4.7% of German companies sell online – higher in absolute count than other countries, but a modest percentage of Germany’s large business universe. This suggests that Germany’s e-commerce market is dominated by a few major players and marketplaces, with fewer small independent webshops per capita. The lower density (and strong local competition) may explain why German SMEs are slightly less aggressive abroad, focusing first on a huge home market.
- Italy: ~76,800 webshops for 58.9 million people is roughly 1.3 per 1,000 inhabitants, the lowest density of the five. Only about 2.8% of Italian companies sell online, reflecting lagging e-commerce adoption among businesses. Italy’s digital retail sector is still developing; many companies have yet to come online or invest in e-commerce channels. This lower maturity means Italian webshops that do operate often have significant room to grow domestically, though the ones that succeed can turn to cross-border sales for additional growth.
Localisation of Last-Mile services
Even as shipments cross borders, the “last mile” must cater to local preferences. Logistics firms should note that a Danish package destined for Sweden or a Dutch package to France will require localised last-mile handling – from language-specific notifications to preferred delivery methods (locker pickup, home delivery culture, etc.). Adapting delivery options to the recipient country’s norms increases success. For instance, offering Pakketboxen or parcel lockers in the Netherlands/Belgium, home delivery with SMS coordination in Germany, or convenient pickup points in Sweden/Denmark can improve customer experience. Cross-border delivery success is not just about moving goods across distance, but also navigating the “last kilometre” in a foreign context. Providers may need to coordinate returns handling across borders as well, given high return rates in e-commerce – setting up return logistics in the top destination countries can be a competitive advantage for carriers serving exporters.
In conclusion, understanding these dominant cross-border sales channels allows logistics and last-mile providers to align their networks with e-commerce trade flows. By focusing resources on key routes, integrating services regionally, and tailoring last-mile delivery to each market’s needs, providers can improve efficiency and customer satisfaction. The European e-commerce landscape is increasingly interconnected – especially within regional clusters – and logistics firms that adapt to these patterns will be well-positioned to serve both the booming cross-border volumes and the merchants driving them. Ultimately, the continued growth of cross-border e-commerce (nearly €171 billion in Europe in 2021, or ~25.5% of online revenue (ecommercenews.eu)) relies on frictionless logistics. Providers who innovate on these busy corridors will not only reduce costs but also strengthen the entire e-commerce ecosystem across Europe’s borders.
Cross-border online sales are an important growth channel for webshops in Europe’s integrated market. This article examines why certain international sales corridors dominate for e-commerce merchants in five European countries – the Netherlands, Germany, Denmark, Italy, and Sweden. We analyse the top export markets of webshops in each country (based on provided top-10 destination data) and explore the factors behind these patterns, including geography, language, economic ties, consumer behaviour, and logistics integration. We also benchmark the maturity of each country’s e-commerce sector (webshop density and online-selling share).The goal is to provide European e-commerce professionals with insight into existing cross-border flows and how to leverage them.
Cross-border corridors and drivers by country
Netherlands: Neighbours, shared language and trade hub reach
Dutch webshops are remarkably outward-looking, with nearby Belgium and Germany as the top destinations for online exports. Belgium tops the list (a large portion of Dutch cross-border orders), thanks in part to shared language (Dutch is spoken in Flanders) and immediate proximity facilitating quick shipping. Likewise, Germany – Europe’s largest e-commerce market – is a close neighbor and a natural target for Dutch retailers. Geographic centrality and excellent logistics infrastructure in the Netherlands (Rotterdam port, Schiphol airport) make it a hub for distributing goods across Western Europe, so Dutch webshops easily serve France, Spain, and Italy as well (ecommercegermany.com). Many Dutch merchants localise in English or multiple languages, leveraging the population’s high foreign language proficiency. These factors, combined with the Netherlands’ high Internet penetration and consumer spending, explain why Dutch online sellers extend their reach broadly into Europe. The cross-border focus is diverse, but the Benelux and adjacent EU markets dominate Dutch e-commerce exports.
Germany: A giant at home with strong neighbour links
German webshops tend to have a more regional cross-border focus, reflecting Germany’s huge domestic market which somewhat lessens reliance on exports. Nevertheless, German retailers mainly ship to German-speaking neighbours, especially Austria (the top export market) and Switzerland, as well as the Benelux countries (ecdb.com). Austria’s shared German language and culture make it a natural extension of the domestic market, and indeed over half of Austria’s cross-border e-shopping is from Germany (ecdb.com), illustrating this tight linkage. Similarly, a high share of Luxembourg’s online imports come from German sites (ecdb.com), aligning with Germany listing Luxembourg among its top export destinations. Beyond these, German e-sellers target large EU economies like France, Italy and Spain, but volumes there are lower relative to Germany’s size. Geographic proximity and EU single-market ties play a key role – Germany’s neighbours (Austria, Netherlands, France, Poland, Denmark, etc.) comprise most of its top 10 export markets. While Germany has the most e-commerce sales in Europe, its cross-border activity (in percentage terms) is more modest than smaller countries’, as its home market is very self-sufficient. Still, German webshops capitalise on being in the center of Europe by serving nearby countries with minimal barriers.
Denmark: Nordic integration and broader EU outreach
Denmark’s online retailers are highly oriented toward Nordic and nearby EU markets. The top export destination is Sweden, Denmark’s neighbour across the Øresund bridge, reflecting strong regional integration. Danish merchants benefit from cultural and linguistic affinities within Scandinavia (Danish and Swedish are mutually intelligible to a degree), and importantly from a merged postal network (PostNord) that eases Denmark–Sweden deliveries. Germany is the second-most common destination for Danish webshops – a logical outcome of geographic adjacency and Germany’s market size. Other top targets include the Netherlands, France, and Belgium, indicating Danish online retailers don’t confine themselves to Scandinavia. High English proficiency in Denmark and use of international e-commerce platforms enable even small Danish webshops to sell into distant European markets. Finland and Norway also appear in Danish sellers’ top corridors, consistent with a Nordic e-commerce cluster. In sum, proximity and regional ties drive much of Denmark’s cross-border trade, but Danish companies’ agility and the necessity to grow beyond a small domestic market push them to court major economies across Europe as well.
Sweden: Regional strength and EU market access
Swedish webshops likewise show a strong Nordic focus coupled with EU-wide reach. Denmark and Finland rank among the top export markets for Sweden’s online retailers, owing to Sweden’s position bridging Nordic neighbours (and sharing a land border with Finland). Cross-border commerce within the Nordics is bolstered by relatively aligned consumer habits and the prevalence of English, though language differences (Swedish vs. Finnish) still pose some barrier. Sweden’s list of top e-commerce export destinations also features Germany, the Netherlands, France, Spain, and Belgium, mirroring a broad Western European outreach similar to Denmark’s. Sweden’s e-merchants benefit from being in one of Europe’s most digitally mature societies, and they leverage efficient logistics links (for example, ferry routes and international carriers) to serve far-flung customers. Still, the easiest wins are nearby: Denmark alone accounts for a significant share of Swedish cross-border online sales, exemplifying how regional integration (e.g. PostNord’s bi-national network) underpins cross-border e-commerce in Scandinavia.
Italy: Big EU partners and niche appeal abroad
Italian webshops, operating in a large but traditionally less digitized market, concentrate their cross-border sales on Europe’s biggest economies and nearby countries. Germany is the number-one export destination for Italian online sellers by volume, followed closely by France and Spain, which together account for a large majority of Italy’s e-commerce exports (amavat.eu). This reflects both geographic proximity (France and Austria border Italy, and Germany is just beyond the Alps) and strong demand for Italian products (e.g. fashion, design, food) in wealthier EU markets. Austria is another key corridor (benefiting from adjacency and a shared German-language business environment), and neighbors Switzerland and Slovenia (not in the top-ten list provided, but likely significant) also draw Italian exports. Interestingly, Northern European markets like the Netherlands, Belgium, Denmark, Sweden and Poland appear among Italy’s top export destinations as well – indicating that Italian brands have appeal across Europe despite distance. Italy’s cross-border e-commerce has been surging in recent years, growing its share of total online turnover from ~29% to 39% between 2019 and 2022 (amavat.eu). However, Italian webshops are relatively fewer per capita, so much of this cross-border activity is driven by a subset of competitive firms (often via marketplaces). In summary, Italy’s e-commerce exports gravitate toward large EU consumer markets and nearby neighbors, leveraging Italy’s renowned products, even as the domestic e-commerce sector catches up in maturity.
Similarities and differences in cross-border focus
Despite national nuances, these five countries share some common patterns. Neighboring countries dominate cross-border e-commerce flows in many cases – a classic gravity effect where shorter distances, lower shipping costs, and familiar cultures facilitate trade. For example, the Netherlands-Belgium, Germany-Austria, and Denmark-Sweden corridors are all top-ranked, underscoring the importance of geographic proximity and shared language or cultural ties. This aligns with research finding that even online, distance and cultural/language factors still significantly impact trade (though less than offline) (econstor.eu). Additionally, all five nations see major EU economies (Germany, France, Spain) in their export mix. These large markets are attractive targets due to their sheer number of online shoppers – Germany and France are among Europe’s top destinations for cross-border e-commerce imports (ecommercegermany.com). In fact, German consumers are so pivotal that every country’s webshops list Germany as a top-3 foreign market (except Germany itself), and German shoppers account for a sizeable share of many neighbour's’ online sales (ecdb.com).
However, there are clear differences in scope. The smaller, digitally advanced countries (Netherlands, Denmark, Sweden) tend to export to a broader array of markets across Europe, reflecting their need to go global to scale beyond limited domestic populations. Their top-10 lists include more distant EU distinations – enabled by strong English usage and pan-European platforms. In contrast, Germany and Italy (the larger markets) show a relatively more regional focus, concentrating on immediate neighbors and a few key economies. German webshops’ cross-border sales are more regionalized (e.g. mostly EU neighbors), and Italy’s exports tilt heavily to Western Europe (with limited Nordic focus). Another difference is the reciprocity of corridors: e.g. Denmark and Sweden mutually rank each other very high, whereas Italy and Germany have an asymmetry (Italy relies on Germany more than Germany on Italy). This hints at differing product specializations and consumer preferences driving flows one way more than the other. Finally, language plays a part – shared language pairs (Dutch-Flemish, German-Austrian, Scandinavian languages) clearly boost mutual e-commerce, whereas language barriers can limit cross-border reach unless sellers localise (which not all Italian or German SMEs do as readily as Nordics). Overall, all five countries leverage the borderless EU market, but the extent of their reach and the partners they prioritize vary with their size, culture, and e-commerce sophistication.
E-Commerce maturity benchmark
The strength of a country’s e-commerce sector underpins its cross-border capabilities. Two useful indicators are the number of webshops per capita and the share of companies engaging in online sales. Below is a brief benchmark of the five countries:
- Denmark: ~40,700 webshops for 5.9 million people – roughly 6.9 webshops per 1,000 inhabitants, one of the highest densities in Europe. Around 7.3% of all Danish companies sell online, indicating a very mature digital commerce environment (many firms extend sales to the web). This high density provides Denmark with a rich base of exporters, from niche boutiques to large players.
- Netherlands: ~119,600 webshops on a population of 18 million gives about 6.6 webshops per 1,000 people nearly on par with Denmark’s density. Approximately 6.2% of Dutch companies sell online, making the Netherlands another leader in e-commerce maturity. A combination of scale and density (a large number of stores relative to population) means Dutch e-retailers are both numerous and often well-optimised for international sales.
- Sweden: ~40,500 webshops for 10.6 million people – about 3.8 per 1,000 people, which is a good density but lower than the Dutch/Danish level. Roughly 3.5% of Swedish companies engage in e-commerce. Sweden’s e-commerce is well-established on the consumer side (nearly half of online shoppers buy cross-border (trade.gov)), but the proportion of businesses running webshops, while solid, is moderate compared to the Benelux or Nordics leaders.
- Germany: ~134,400 webshops serving 83.2 million people yields only 1.6 webshops per 1,000 inhabitants, a comparatively low webshop density given Germany’s vast population (tembi.io). About 4.7% of German companies sell online – higher in absolute count than other countries, but a modest percentage of Germany’s large business universe. This suggests that Germany’s e-commerce market is dominated by a few major players and marketplaces, with fewer small independent webshops per capita. The lower density (and strong local competition) may explain why German SMEs are slightly less aggressive abroad, focusing first on a huge home market.
- Italy: ~76,800 webshops for 58.9 million people is roughly 1.3 per 1,000 inhabitants, the lowest density of the five. Only about 2.8% of Italian companies sell online, reflecting lagging e-commerce adoption among businesses. Italy’s digital retail sector is still developing; many companies have yet to come online or invest in e-commerce channels. This lower maturity means Italian webshops that do operate often have significant room to grow domestically, though the ones that succeed can turn to cross-border sales for additional growth.
Localisation of Last-Mile services
Even as shipments cross borders, the “last mile” must cater to local preferences. Logistics firms should note that a Danish package destined for Sweden or a Dutch package to France will require localised last-mile handling – from language-specific notifications to preferred delivery methods (locker pickup, home delivery culture, etc.). Adapting delivery options to the recipient country’s norms increases success. For instance, offering Pakketboxen or parcel lockers in the Netherlands/Belgium, home delivery with SMS coordination in Germany, or convenient pickup points in Sweden/Denmark can improve customer experience. Cross-border delivery success is not just about moving goods across distance, but also navigating the “last kilometre” in a foreign context. Providers may need to coordinate returns handling across borders as well, given high return rates in e-commerce – setting up return logistics in the top destination countries can be a competitive advantage for carriers serving exporters.
In conclusion, understanding these dominant cross-border sales channels allows logistics and last-mile providers to align their networks with e-commerce trade flows. By focusing resources on key routes, integrating services regionally, and tailoring last-mile delivery to each market’s needs, providers can improve efficiency and customer satisfaction. The European e-commerce landscape is increasingly interconnected – especially within regional clusters – and logistics firms that adapt to these patterns will be well-positioned to serve both the booming cross-border volumes and the merchants driving them. Ultimately, the continued growth of cross-border e-commerce (nearly €171 billion in Europe in 2021, or ~25.5% of online revenue (ecommercenews.eu)) relies on frictionless logistics. Providers who innovate on these busy corridors will not only reduce costs but also strengthen the entire e-commerce ecosystem across Europe’s borders.
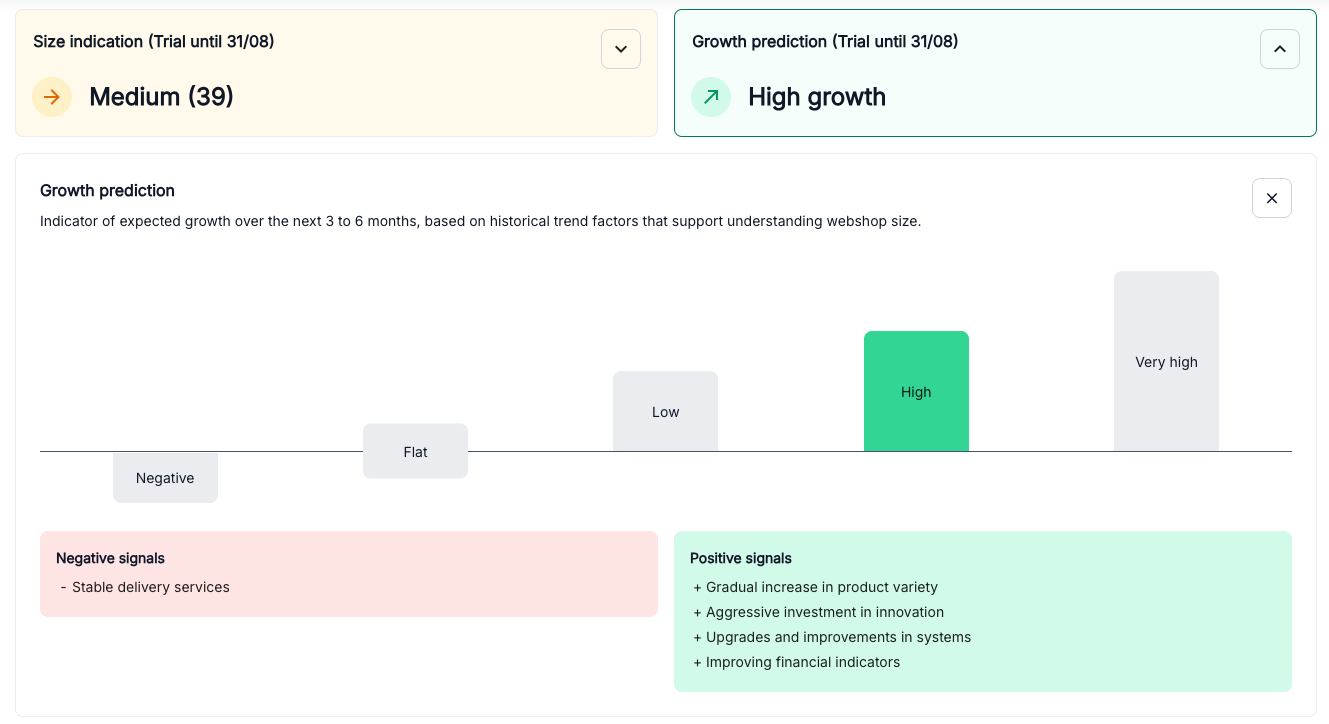


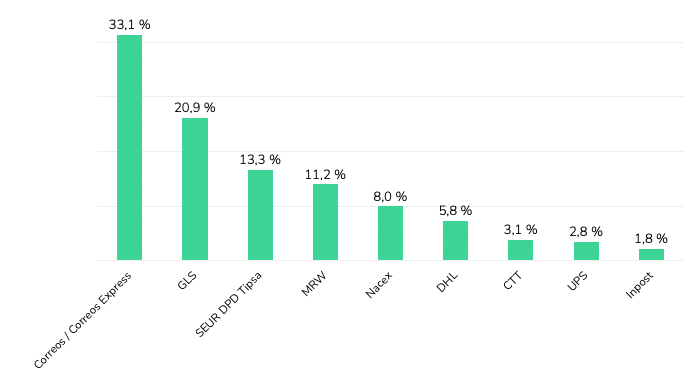


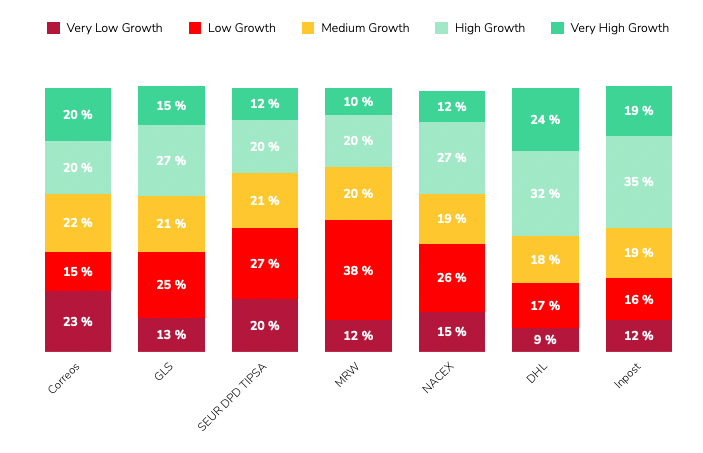
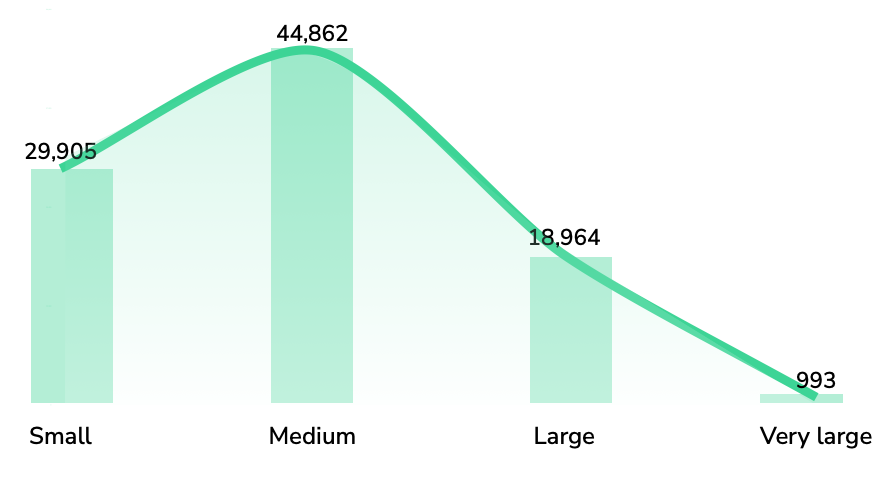
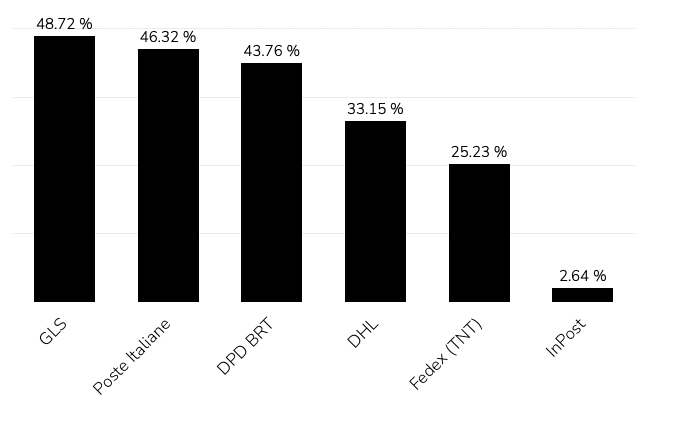

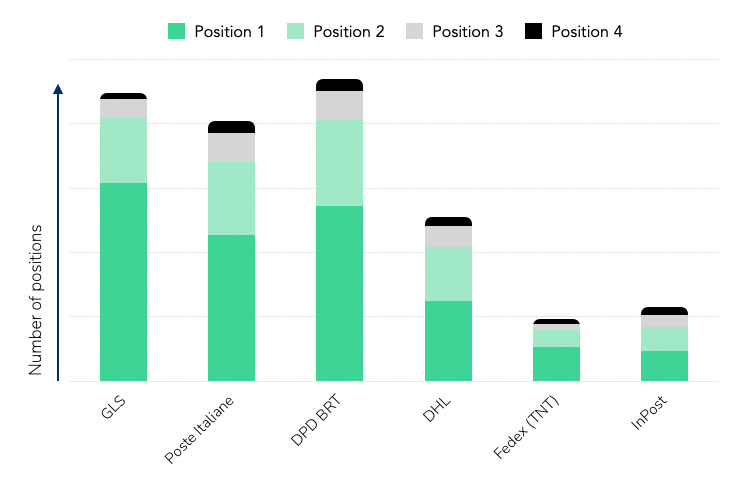
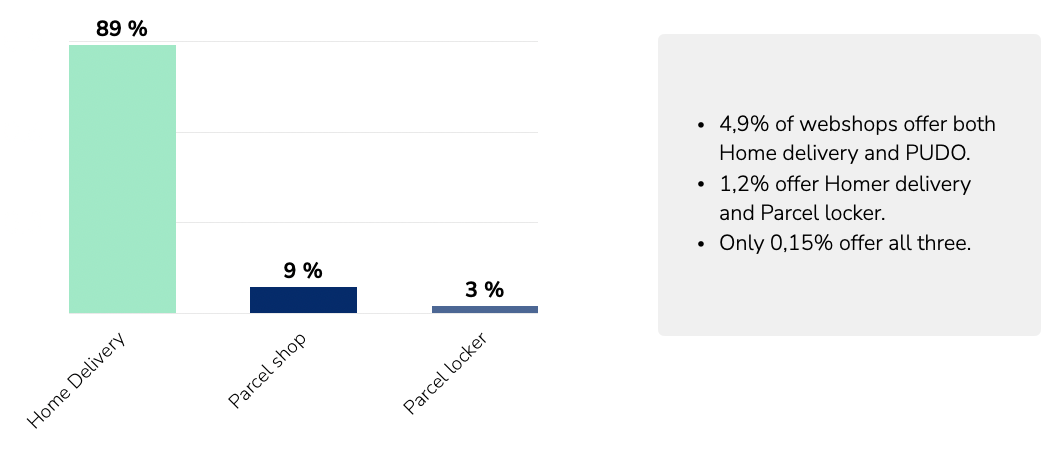

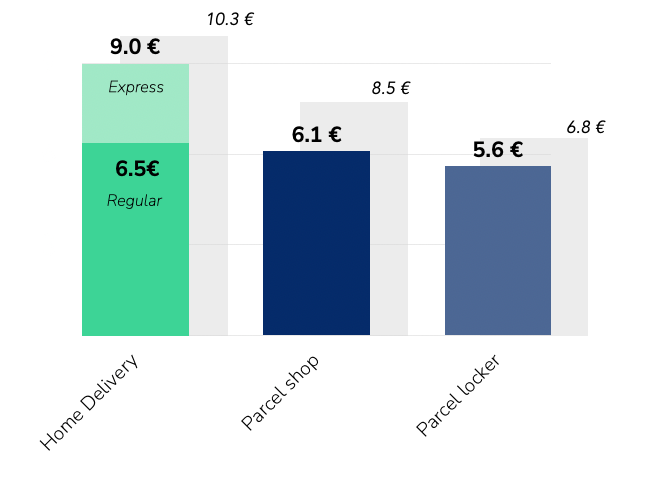
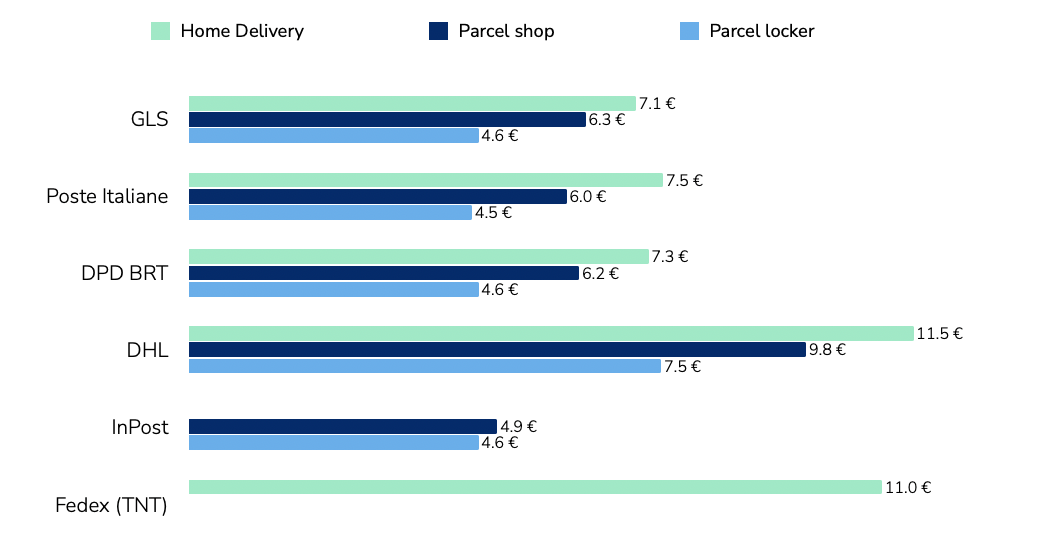
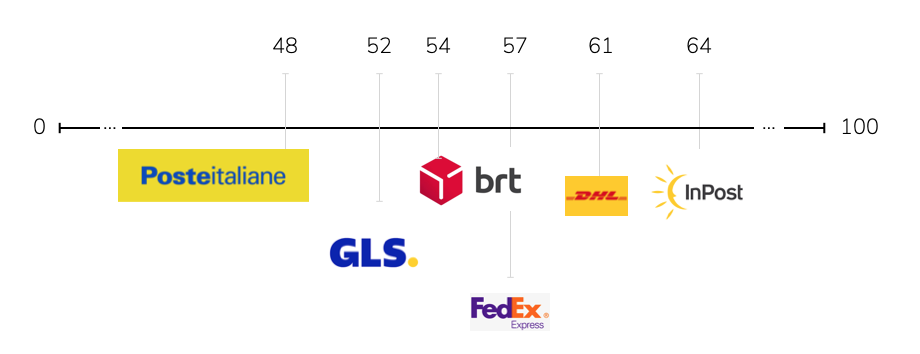

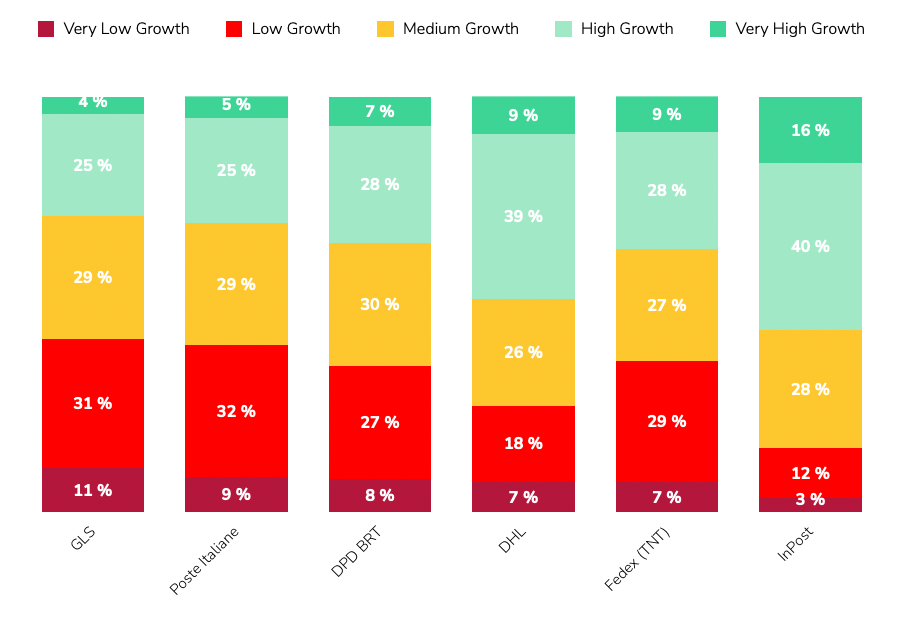
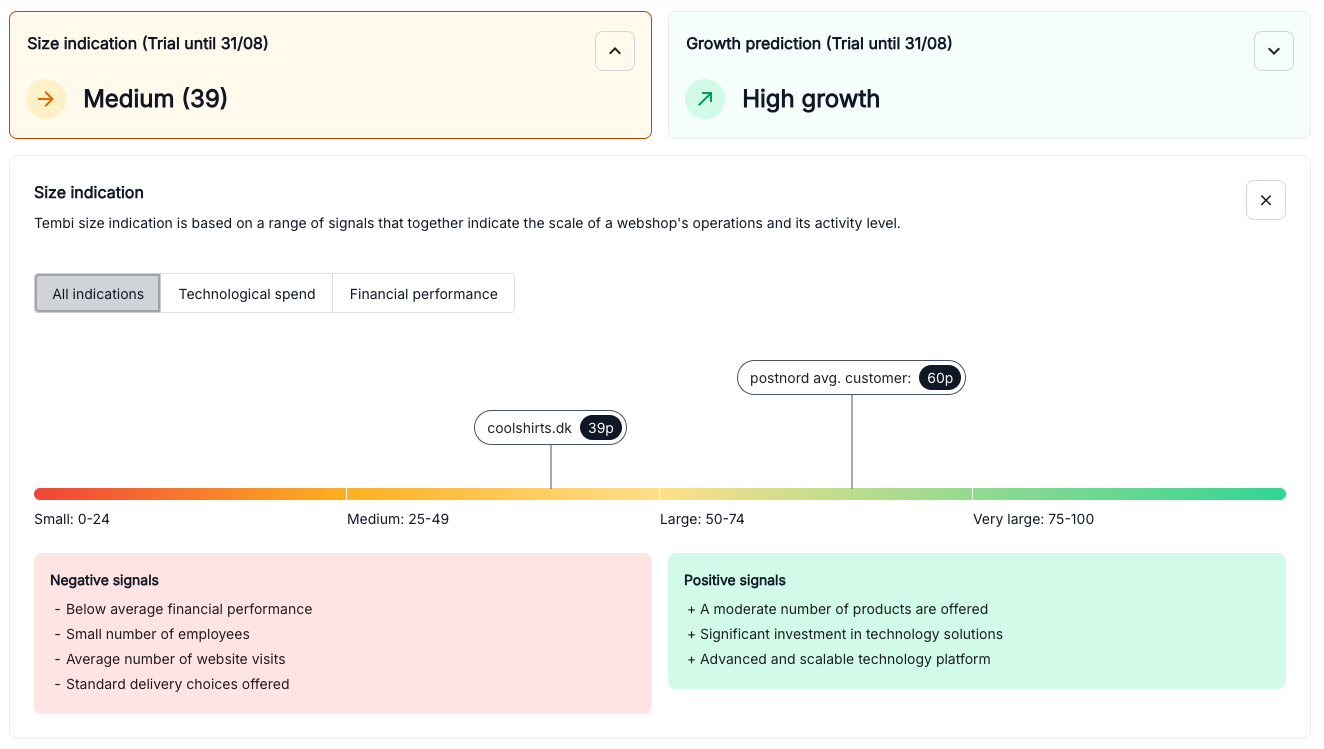
.png)


