


How a Last-Mile delivery commercial team used Tembi to reach online retailers when they were most likely to engage.
The context
A last mile delivery provider was looking to improve how and when they approached new merchant prospects. While they had a solid understanding of who they wanted to work with, outreach often happened too early (before the merchant was ready to switch) or too late (after a competitor had locked in a contract).
Without visibility into what was changing in the merchant’s checkout, reps had to rely on cold outreach, hoping to catch a merchant at the right moment. They needed a way to:
- Identify merchants that were actively reviewing or switching delivery providers
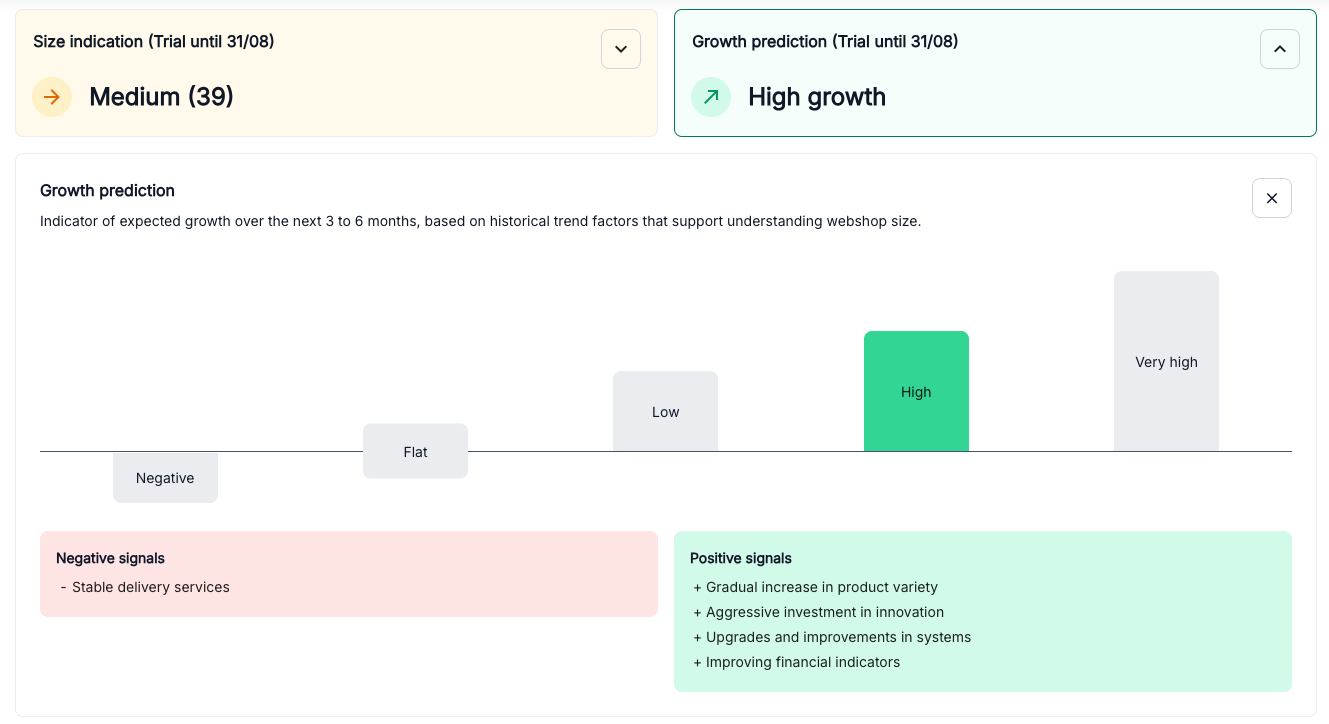
- Spot meaningful signals, like new product categories or delivery method updates
- Align outreach timing with actual changes in the merchant’s delivery setup
What they did with Tembi
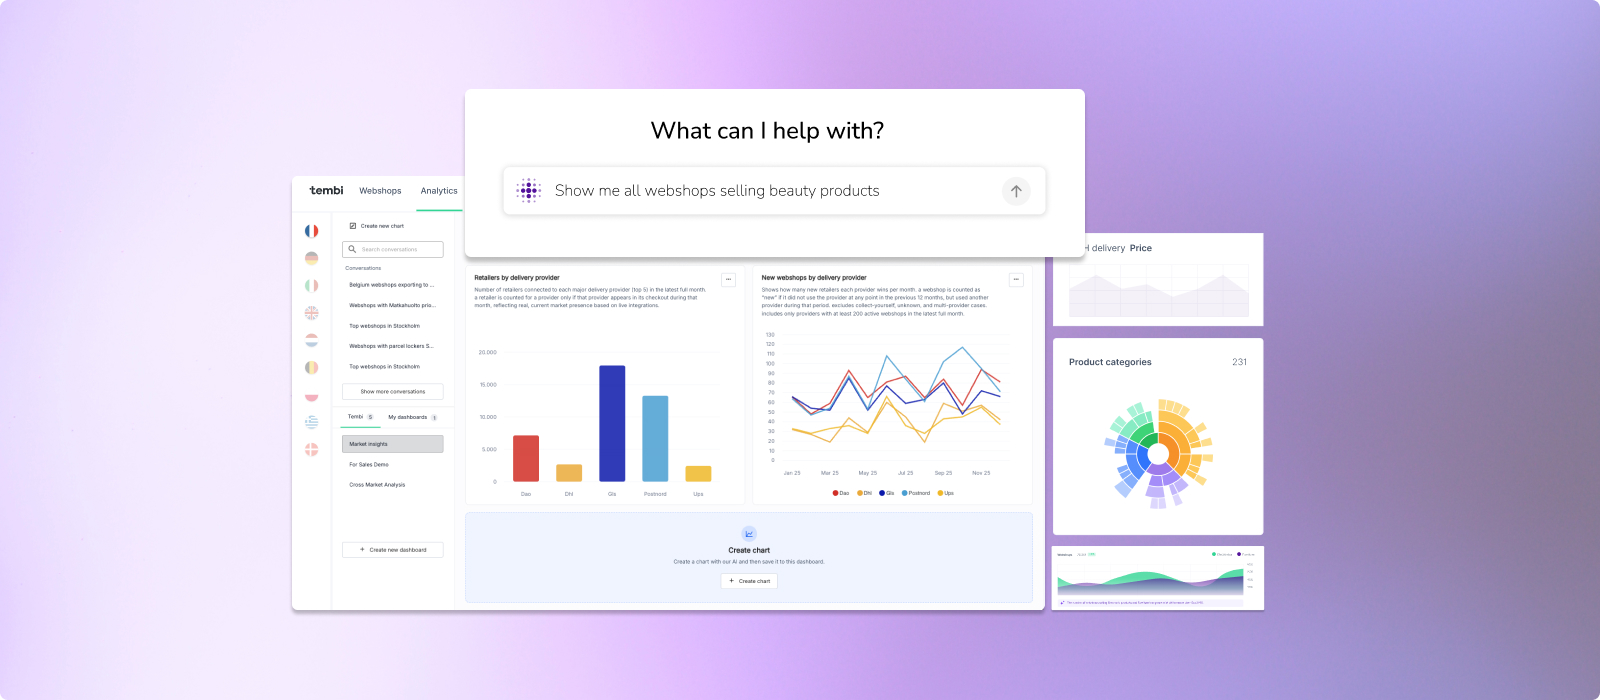
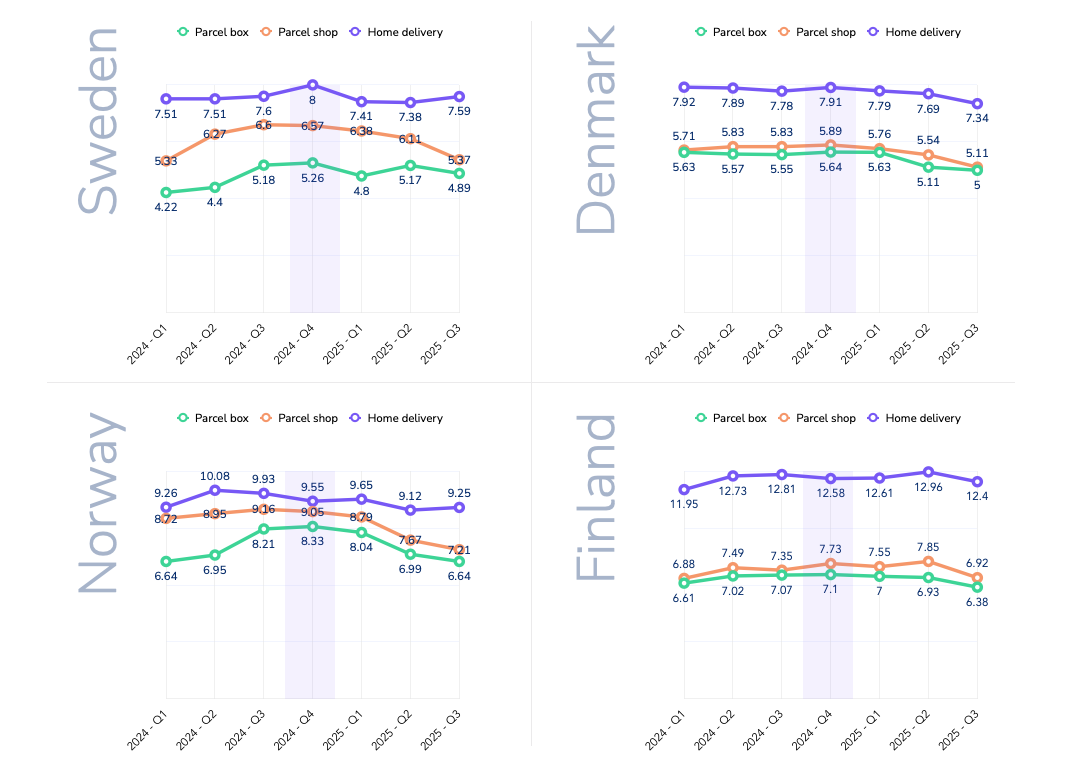
Using Tembi Checkout Intelligence, the team started monitoring live changes in merchant checkout configurations. Tembi scrapers simulate checkout flows on thousands of webshops and detect:
- When a merchant adds or removes a delivery provider
- When delivery pricing or speed options are updated
- When a new product category is added (suggesting operational changes)
- When delivery method names or descriptions shift (e.g. switching from “standard” to “express”)
The team set up biweekly alerts on merchants that matched their ICP and showed recent changes in their delivery stack. This created a dynamic feed of prospects likely to be re-evaluating logistics partners, so an ideal timing for outreach.
The result
The team didn’t need to chase every webshop in a market. Instead, they focused on high-potential accounts showing signs of change. Over a six-week period, they:
- Reached out to 37 merchants flagged by stack change alerts
- Booked 22 first meetings, with 18 confirming they were actively reviewing delivery providers
- Landed 8 new partnerships directly tied to alerts showing recent removals of a competing provider
Timing their approach based on real signals helped them avoid wasted effort and start conversations when interest was highest.
Why it worked
✅ Actionable timing signals was more effective than cold outreach
✅ Changes tracked automatically from actual checkout flows
✅ Focus on merchants in motion who are more likely to convert
✅ Fewer dead ends - reps only acted when there was a reason to reach out
More from
Customer stories
category


A last mile delivery provider operating across several European countries needed to give its regional sales & partnerships team a clearer picture of how competing providers were positioned locally. Without reliable data, the team depended on anecdotal feedback from merchants or patchy CRM notes about which providers were in use. This made it difficult to:
• Prepare for calls with accurate competitor insight
• Spot new merchant opportunities based on delivery gaps
• Build region-specific messaging around speed, tracking, or price
They weren’t seeking a broad market expansion strategy, just precise, local visibility to sharpen commercial conversations.
What was done with Tembi
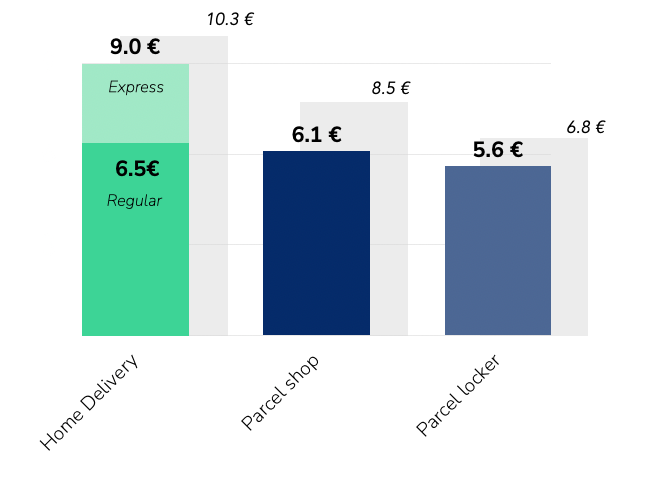
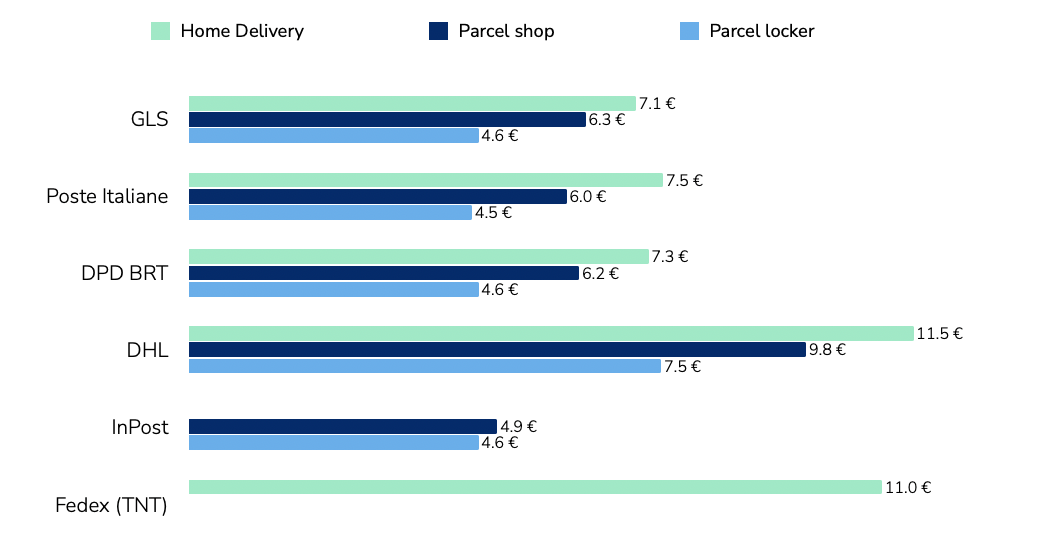
Using Tembi Checkout Intelligence, the team pulled data on hundreds of webshops in their target region. Tembi’s technology visits every retailer with an active webshop and creates visibility into checkout flows and extracts structured data on:
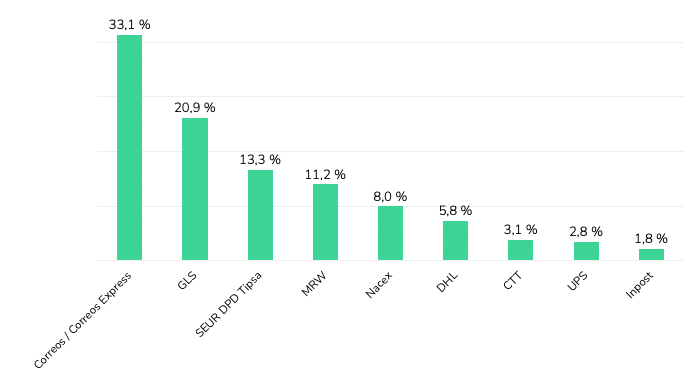
• Which delivery providers are actually offered
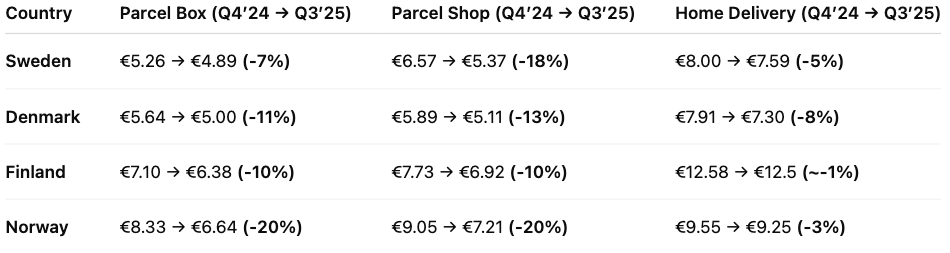
• Delivery speeds and prices
• Labels and methods (e.g. express, standard, tracked) in use
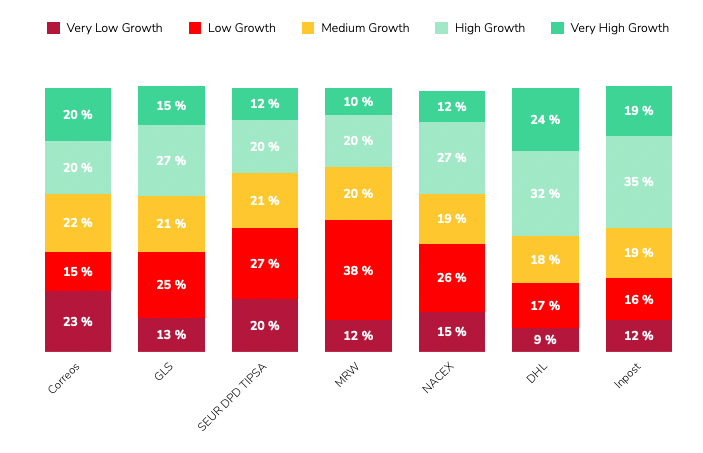
• Recent changes - such as a provider being added or removed
• Images of how delivery options were presented
The data, updated every two weeks, enabled quick filtering by platform (e.g. Shopify, WooCommerce), product category, and country/area. Local sales teams gained a trusted, up-to-date view of the real delivery landscape.
The result
With provider usage clearly mapped for their target region, the team could:
• Enter sales calls with confidence, knowing which competitor was in place
• Spot merchants lacking tracked or fast delivery options
• Tailor outreach to emphasise service gaps (e.g. slow delivery, high fees)
• Build target lists of merchants using weaker providers for displacement opportunities
No major strategic shift - just sharper conversations, better timing, and stronger commercial positioning at the local level. With a 20% increase in conversion.
Why it worked
• Data based on real checkout flows - not assumptions or outdated lists
• Biweekly updates kept teams working with fresh information
• Easy filtering by region and platform enabled targeted, local action
• Directly supported pre-call research, personalised outreach, and competitive mapping
Interested in exploring how Checkout Data and Webshop Monitoring can help you grow your sales? Book a call with one of our Last-mile data experts. Book a demo
A last mile delivery provider operating across several European countries needed to give its regional sales & partnerships team a clearer picture of how competing providers were positioned locally. Without reliable data, the team depended on anecdotal feedback from merchants or patchy CRM notes about which providers were in use. This made it difficult to:
• Prepare for calls with accurate competitor insight
• Spot new merchant opportunities based on delivery gaps
• Build region-specific messaging around speed, tracking, or price
They weren’t seeking a broad market expansion strategy, just precise, local visibility to sharpen commercial conversations.
What was done with Tembi
Using Tembi Checkout Intelligence, the team pulled data on hundreds of webshops in their target region. Tembi’s technology visits every retailer with an active webshop and creates visibility into checkout flows and extracts structured data on:
• Which delivery providers are actually offered
• Delivery speeds and prices
• Labels and methods (e.g. express, standard, tracked) in use
• Recent changes - such as a provider being added or removed
• Images of how delivery options were presented
The data, updated every two weeks, enabled quick filtering by platform (e.g. Shopify, WooCommerce), product category, and country/area. Local sales teams gained a trusted, up-to-date view of the real delivery landscape.
The result
With provider usage clearly mapped for their target region, the team could:
• Enter sales calls with confidence, knowing which competitor was in place
• Spot merchants lacking tracked or fast delivery options
• Tailor outreach to emphasise service gaps (e.g. slow delivery, high fees)
• Build target lists of merchants using weaker providers for displacement opportunities
No major strategic shift - just sharper conversations, better timing, and stronger commercial positioning at the local level. With a 20% increase in conversion.
Why it worked
• Data based on real checkout flows - not assumptions or outdated lists
• Biweekly updates kept teams working with fresh information
• Easy filtering by region and platform enabled targeted, local action
• Directly supported pre-call research, personalised outreach, and competitive mapping
Interested in exploring how Checkout Data and Webshop Monitoring can help you grow your sales? Book a call with one of our Last-mile data experts. Book a demo
The real estate sector, particularly in hospitality, is undergoing a significant shift. With growing data availability and the evolution of AI tools, companies can now make faster, more informed, and more strategic decisions. We recently sat down with Jochen Renz to talk about how he and his team are rethinking real estate development by embracing AI-driven insights.
This article is based on a conversation between Michael Bugaj , CMO at Tembi, and Jochen Renz, VP Operations Accor Switzerland & Southern Germany and Managing Director AccorHotels Switzerland.
The challenge of predicting growth
Jochen begins by highlighting a central challenge in real estate development: identifying areas with future growth potential. "The question was, how can I ensure we define areas in a country with further potential growth than we might see today?" he explains. Traditional methods - macro- and microeconomic research, political and demographic analysis - often look backward, relying on historical data to predict future trends.
However, Jochen was looking for more than that. He wanted forward-thinking tools that could help them predict, not just reflect. This desire for a proactive approach led Jochen and his team to explore AI-powered solutions.
Discovering Tembi
One of the tools Jochen explored is Tembi, a platform that helps identify emerging opportunities in different areas of cities based on continuously updated market data. While not yet rolled out in Switzerland, the tool was originally developed in Denmark and stood out to Jochen as a promising forward-looking platform.
"Tembi allowed us to do predictions in areas based on logistics, different sectors, and growing patterns," Jochen shares. "I compared this with more traditional development tools, and what stood out was its ability to look forward by analyzing data such as employer growth, financial data, and sector movements."
From manual labor to scalable insights
Traditionally, site selection was a heavily manual task involving fragmented data sources. Jochen’s team would combine macroeconomic data with localized insights, looking at street-level factors, emissions, and building potential. External consultants were often brought in to help collect and validate this information. "The consistent approach is not easy to achieve," he admits.
With AI-driven tools like Tembi, however, the potential for change is clear. While still a work in progress, the promise lies in being able to access relevant data for hundreds or even thousands of locations more quickly than before. Jochen notes that with tools like Tembi, it's becoming increasingly feasible to explore broader market patterns and opportunities in a more scalable way.
Replicable patterns across borders
Jochen shared an example from Denmark: a promising opportunity in Odense. “I had never heard of the city before,” he laughs. “But by setting a few filters, we uncovered a significant movement in the city that revealed a growing need for hotels.”
With tools like Tembi, such discoveries become replicable. “You could look for similar movements in Sweden, Poland, or Belgium, just by changing the location input. That’s the power of structured data paired with AI.”
A shift in real estate mindset
The ability to anticipate development opportunities earlier in the cycle will give companies a strategic edge. "If we know an area is developing and we can suggest the right brand early on, we influence the project from the beginning," Jochen explains. "That positions us in a completely different way in the value chain."
Lowering the barrier to smart decisions
Perhaps one of the most powerful applications of AI, Jochen believes, is making complex data more accessible. "Think about someone running a 7-Eleven or Domino's Pizza franchise, they're not developers," he says. "But if AI can give them confidence in a location based on structured data, that opens up huge possibilities."
This democratization of insight, paired with AI’s ability to remove emotional bias from decisions, is transforming how Accor - and potentially the wider industry - approaches site selection.
Looking ahead
As AI continues to evolve, Jochen envisions a future where real estate teams can monitor hundreds of markets at once, identifying trends and acting faster than ever before. “You don’t have to focus on one area anymore, you can analyze 100 areas and synthesize it down to the two best opportunities. That’s game-changing.”
The intersection of human insight and machine intelligence is reshaping real estate development. For Jochen and the team at Accor, tools like Tembi have the potential to become more than just another platform - they could evolve into essential partners in strategic growth.
As this conversation shows, the integration of AI into real estate decision-making isn't just a technical evolution, it's a shift in mindset. By empowering teams with better tools, clearer data, and broader perspectives, platforms like Tembi can help companies like Accor stay ahead in an increasingly competitive and fast-moving market.
Stay tuned for more stories like this as we continue to explore the intersection of AI and real-world strategy across industries.
Customer story: Clerk.io
How Clerk.io used Tembi's E-commerce Intelligence to explore new markets and improve lead quality.

About Clerk.io
Clerk.io is a leading e-commerce personalisation platform, helping thousands of webshops optimise their customer experience through tailored product recommendations, search, and email personalisation.
The challenge
Clerk.io needed to address two main challenges:
- Market exploration: Understanding market potential in different regions to identify high-priority growth opportunities.
- Lead quality: Ensuring lead accuracy to reduce time spent manually qualify ing irrelevant or unfit leads
Christian, Head of Lead Generation at Clerk.io, explained: “We were looking for a solution to scan markets and get a clear understanding of their potential. At the same time, we needed to ensure the leads we pursued met specific criteria, like being transactional webshops. Our previous provider couldn’t consistently deliver on these fronts.”
The solution: Partnering with Tembi
Clerk.io turned to Tembi to tackle these challenges. With Tembi's market data & intelligence, the team gained access to:
- Detailed market insights: Tembi helped Clerk.io identify untapped opportunities by filtering markets based on factors like product count, visitor volume, and transaction data.
- Improved lead accuracy: Tembi’s platform allowed Clerk.io to focus on high-potential leads while significantly reducing manual qualification time through Tembi’s webshop validation software.
Christian highlighted the impact: “Tembi gave us a market feeling. For example, in Norway and Sweden, we could see the potential and decide if this was something we should double down on. The data helped us make informed decisions about where to focus our sales efforts. And 98% of the leads we identified via Tembi were qualified, allowing us to focus on high-quality opportunities without loosing time on irrelevant prospects.”
The results
1. More Accurate Leads. By leveraging Tembi's validation process and advanced filtering tools, Clerk.io increased the accuracy of its leads.Only 1% were unqualified, and another 1% didn’t match the ICP criteria.
2. Time savings. Manual qualification time was massively reduced, allowing the team to allocate resources more effectively.
3. Market viability assessments. Clerk.io used Tembi to assess markets likeNorway and Sweden, deciding where to prioritise their efforts for maximum growth potential.
“Tembi made qualifying leads less time-consuming, and the time savings alone justified the investment,” said Peter, Head of Marketing at Clerk.io.’
A seamless partnership
Beyond the technical aspects, Clerk.io found their collaboration with Tembi to be seamless and productive. Peter Tullin, CMO at Clerk concluded: “We’ve been very happy with Tembi. It was a seamless collaboration, and their local Copenhagen office made it even easier to work together.”

How Clerk.io used Tembi's E-commerce Intelligence to explore new markets and improve lead quality.
About Clerk.io
Clerk.io is a leading e-commerce personalisation platform, helping thousands of webshops optimise their customer experience through tailored product recommendations, search, and email personalisation.
The challenge
Clerk.io needed to address two main challenges:
- Market exploration: Understanding market potential in different regions to identify high-priority growth opportunities.
- Lead quality: Ensuring lead accuracy to reduce time spent manually qualify ing irrelevant or unfit leads
Christian, Head of Lead Generation at Clerk.io, explained: “We were looking for a solution to scan markets and get a clear understanding of their potential. At the same time, we needed to ensure the leads we pursued met specific criteria, like being transactional webshops. Our previous provider couldn’t consistently deliver on these fronts.”
The solution: Partnering with Tembi
Clerk.io turned to Tembi to tackle these challenges. With Tembi's market data & intelligence, the team gained access to:
- Detailed market insights: Tembi helped Clerk.io identify untapped opportunities by filtering markets based on factors like product count, visitor volume, and transaction data.
- Improved lead accuracy: Tembi’s platform allowed Clerk.io to focus on high-potential leads while significantly reducing manual qualification time through Tembi’s webshop validation software.
Christian highlighted the impact: “Tembi gave us a market feeling. For example, in Norway and Sweden, we could see the potential and decide if this was something we should double down on. The data helped us make informed decisions about where to focus our sales efforts. And 98% of the leads we identified via Tembi were qualified, allowing us to focus on high-quality opportunities without loosing time on irrelevant prospects.”
The results
1. More Accurate Leads. By leveraging Tembi's validation process and advanced filtering tools, Clerk.io increased the accuracy of its leads.Only 1% were unqualified, and another 1% didn’t match the ICP criteria.
2. Time savings. Manual qualification time was massively reduced, allowing the team to allocate resources more effectively.
3. Market viability assessments. Clerk.io used Tembi to assess markets likeNorway and Sweden, deciding where to prioritise their efforts for maximum growth potential.
“Tembi made qualifying leads less time-consuming, and the time savings alone justified the investment,” said Peter, Head of Marketing at Clerk.io.’
A seamless partnership
Beyond the technical aspects, Clerk.io found their collaboration with Tembi to be seamless and productive. Peter Tullin, CMO at Clerk concluded: “We’ve been very happy with Tembi. It was a seamless collaboration, and their local Copenhagen office made it even easier to work together.”


.png)


