


ith the E-commerce Intelligence Platform (EIP), we have set out on one of our most ambitious data and analytics ventures yet: to authenticate and catalog every webshop globally, defining product categories, individual products, and the delivery infrastructure. Our aim is to build the most expansive and current e-commerce database, one that can proactively empower webshops, carriers & delivery providers, and suppliers to navigate through the dynamic, ever-expanding market.
EIP was first introduced in Denmark in 2021 and has since extended its reach to Sweden, Norway, Finland, the Netherlands, Latvia, Lithuania, and Estonia. To date, we systematically and repeatedly index, validate and analyze over 200,000 webshops, classifying them into different product categories.
So, why embark on this colossal task?
The objective behind EIP is to provide the industry with unparalleled Market Intelligence. To achieve this, it was imperative for us to go beyond the surface-level offerings and gain a deep understanding of the last-mile delivery mechanics, the various providers involved, and the pricing structures.
Benefits of EIP
All webshops in one place
EIP offers a comprehensive market overview, identifying and validating every operational webshop, while discarding inactive ones. We have established a direct link between each webshop and its owner, detailing ownership, headquarters, and financial figures. By evaluating the webshops' offerings and categorizing their products, we understand the technological platforms utilized and the delivery services provided, including pricing and export capabilities.
Our "Market Scrape" equips users with a detailed snapshot of all webshops in a specific market. For deeper insights, particularly into the largest, custom-built webshops, our "Custom Scrape" service offers an in-depth analysis.
Checkout monitoring
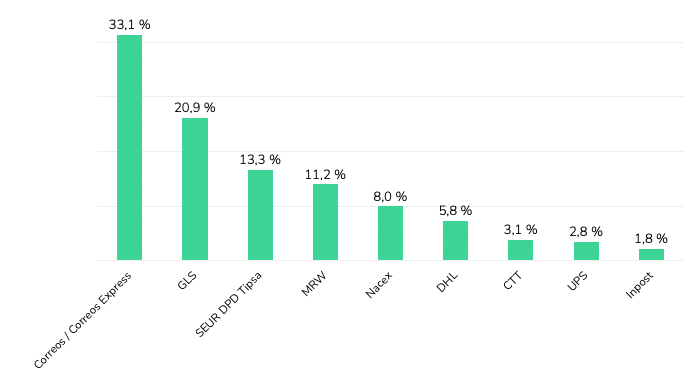
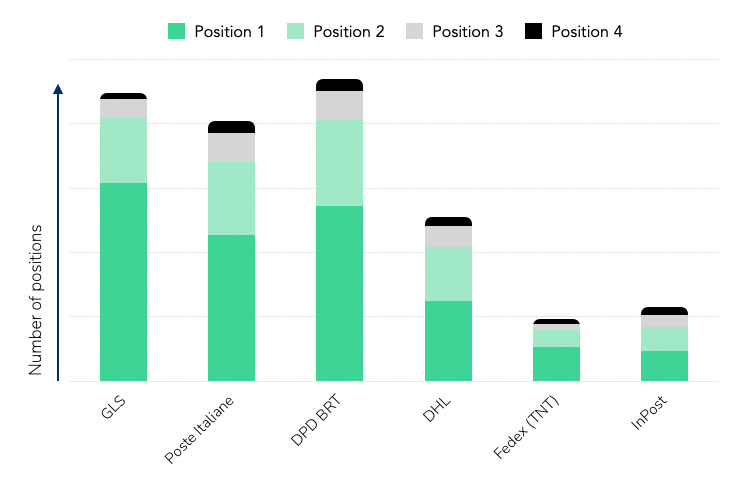
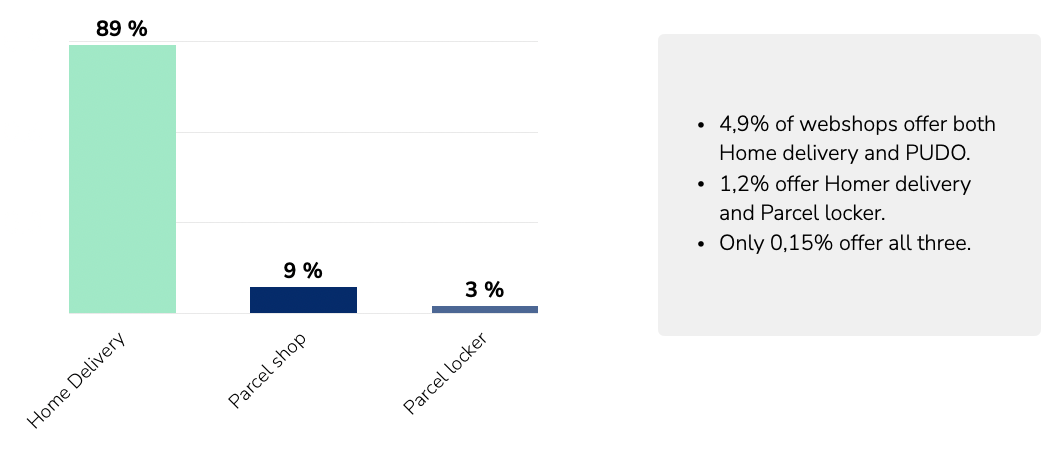
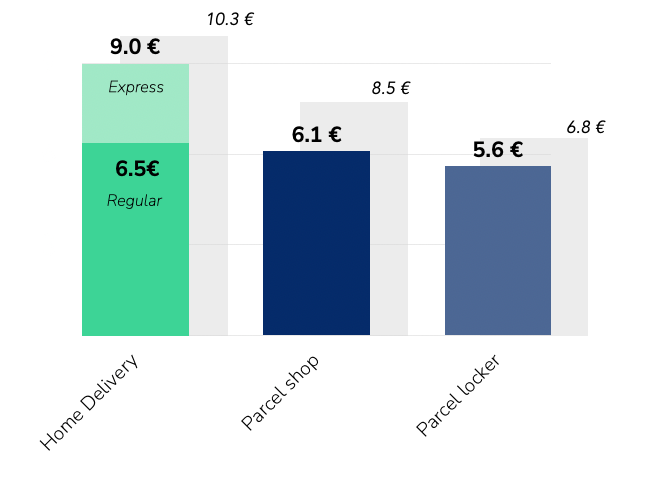
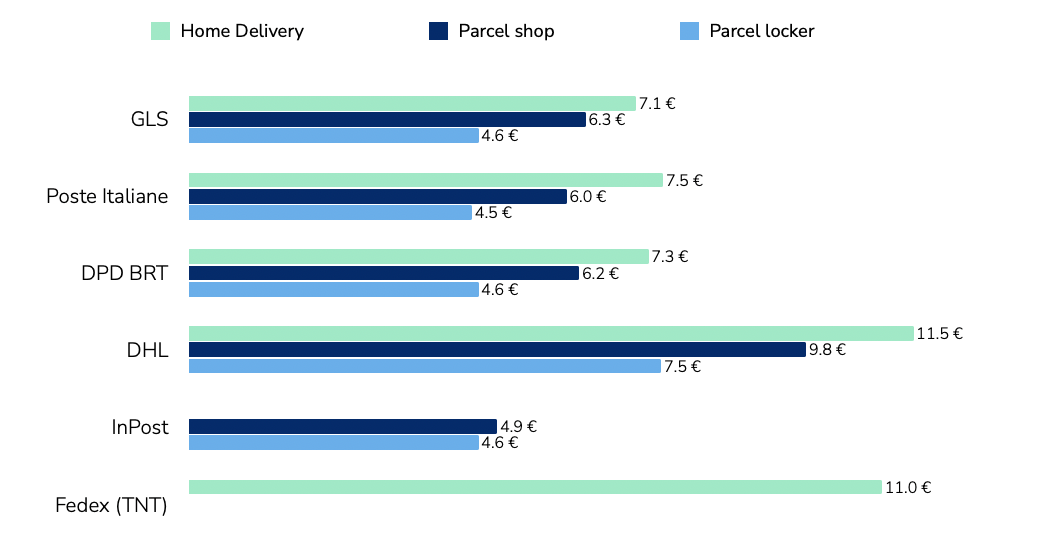
Understanding the last-mile market, we monitor each delivery checkout on all webshops, gathering information about providers and their position on the list of delivery options, delivery methods and prices, free-delivery threshold, and green delivery options – giving us comprehensive view of the shipping market and how it evolves from a public perspective.
We keep a pulse on the last-mile delivery market by continuously monitoring checkout processes across webshops. This monitoring captures data on delivery providers, their ranking in delivery options, pricing strategies, thresholds for free delivery, and eco-friendly shipping options, thereby offering an overview of the evolving shipping landscape.
Decision-ready Market Intelligence
Merging our data with metrics like order volumes allows last-mile delivery providers to proactively respond to changes in their checkout positioning, preventing potential revenue drops.
“Prior to Tembi, identifying a lost position at a store’s checkout could take up to six weeks, during which we would lose about 64% of order volumes. With EIP's immediate updates, we can swiftly address the issue, preventing significant revenue losses”
Webshop integration manager
Let us say you charge €3,0 per delivered package and expect 100 packages per day (on average). The daily revenue is €300. Losing 64% of the volume equals to a loss of €192 per day. During six weeks that loss amounts to €8.064.
With EIP, as soon as a positioned is lost, you are notified, and can talk to the store, and manage your delivery operations immediately.
From a strategic perspective, both as a webshop owner, as well as delivery provider, you can track which delivery methods are popular, what are the market prices, and where is the market developing, both on your own market, but also abroad.
Automated lead generation
Understanding the supplier network of providers for webshops within different fields - delivery, payments, and technology - opens an overview of who works with whom. Giving providers competitive intelligence and a perfect data set for lead generation and prospecting.
As a delivery provider, being able to see all your clients in one simple overview with metadata, you will equally see where you are not present. By understanding previous relationships and solutions used, you can improve your sales pitch and competitive edge.
EIP use-cases
There are multiple ways to use EIP and the data. Here are a couple of examples.
EIP for Account Managers
See what technologies your clients are using, and which providers they work with. If you work with last-mile delivery, you can see your position in each check-out and follow your client's business and get the latest data before your check-up.
EIP for prospecting
Whether you work with professional services for webshops or selling software, you can find each webshop on your market and find precisely the type of webshop you are looking for with our filters.
EIP for Business Development
See and follow market trends, track your competitors and always be up to date.
EIP for Customer Success
From the moment you have a new client, follow the implementation and results. Track critical changes and get access to detailed customer business information.
EIP for Analysts and Business Intelligence
Via our API you can extract all our data to your own system and combine external data with your internal data to track correlations, get a full competitor, and market overview.
“A dynamic market requires ongoing data collection.”
Christian Mejlvang, head of product at Tembi
The technology behind EIP
Our data foundation is robust, encompassing over five billion data points, which include both real-time and historical data collected from 2021. We augment this repository daily with over one million data points to guarantee not only the high quality of our data but its relevance as well.
Utilizing diverse machine learning techniques such as AI (Artificial Intelligence), NLP (Natural Language Processing), LLM, and image recognition, we convert raw data into actionable intelligence, aligning with our commitment to transforming data into insight. This data undergoes a process of enrichment, contextualization, and multi-level automated verification to ensure its integrity. We categorize our data into three tiers of quality—Bronze, Silver, and Gold—and it is only the Gold-standard data that is displayed on the EIP platform, reflecting our dedication to the highest standards of excellence.
Our data acquisition strategy is multifaceted: 1) sourcing open data, 2) procuring datasets from various providers, 3) deploying our proprietary scrapers to gather exclusive data, and 4) generating novel data through analytical methods applied to the data we have. This fourth approach underpins our Predictive Market Intelligence service.
We employ a combination of econometric and predictive machine learning models to create proprietary datasets. These are instrumental in our analysis of market trends and trajectories, providing an innovative perspective on market dynamics.
Interested in knowing more about EIP? Contact us.
More from
Product
category


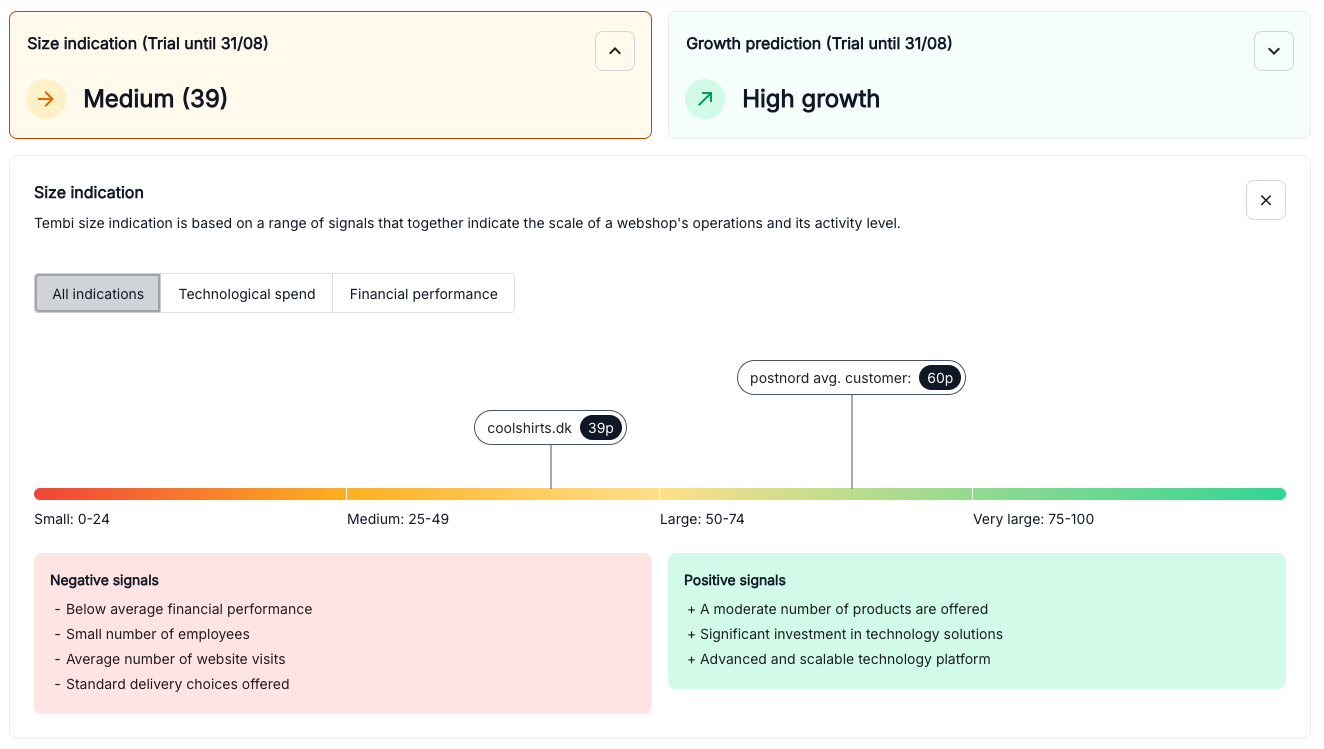
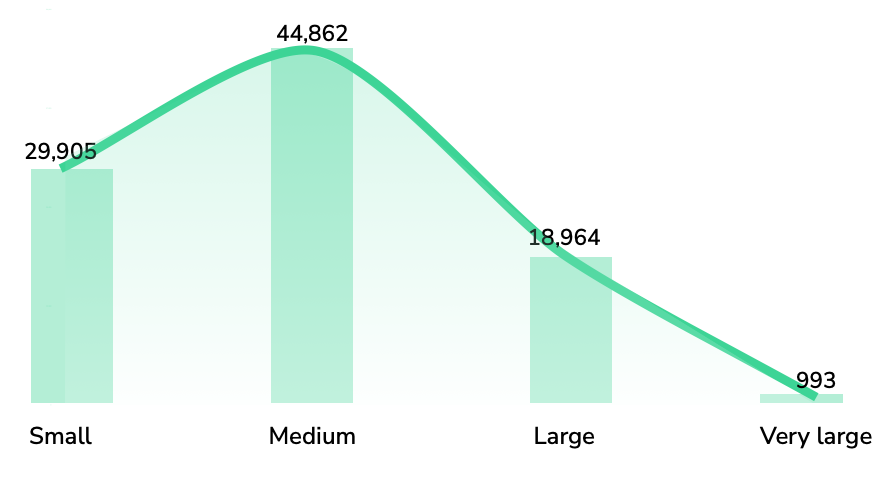
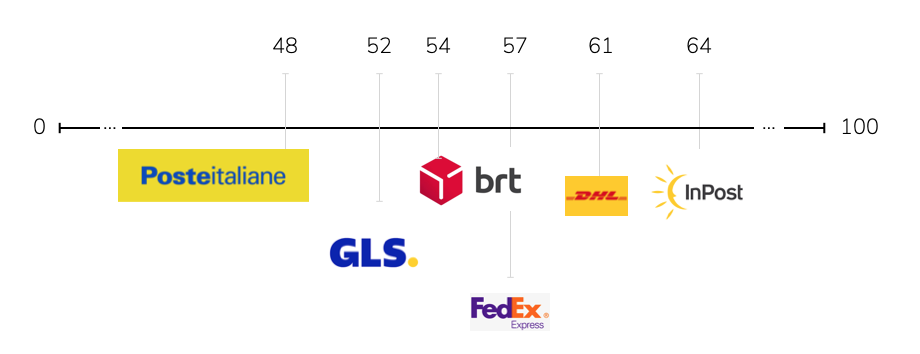
Knowing which webshops to focus on helps your business succeed. That’s why we've launched Tembi’s Size indication, a simple way to quickly understand how active and big (or small) any webshop is in the market compared to the largest online retailers.
What is the Size indication?
Tembi’s Size indications scores webshops from 1 to 100 points, dividing them into clear groups:
- Small: 0-24 points
- Medium: 25-49 points
- Large: 50-74 points
- Very Large: 75-100 points
This makes it easy to compare webshops and see where they stand compared to others.
How does it work?
The Size indication uses hundreds of data points per webshop to decide each webshop’s score, including:
- Size and variety of product offerings
- Investment in technology and infrastructure
- Amount of website traffic
- Types of delivery methods provided
These factors, and many more, provide a clear picture of how active and large a webshop is. Each webshop’s score is clearly explained, showing both positive and negative factors.
Why the Size indication is useful
The Size indication makes market analysis simpler. You can quickly assess market size and find webshops that fit your ICP. When looking at thousands of prospects, Size indication allows you to sort all webshops, and see their size in relation to each other.
Combine Size indication with Growth Predictions
Tembi’s Size indication works hand-in-hand with our Growth Predictions feature. By combining these insights, you get a complete view of the market opportunity - clearly identifying which webshops are not only large and active but also likely to grow. This powerful combination helps you pinpoint the best opportunities for strategic action and growth.
Want to get started?
Log in to Tembi and check out the Size indication now. All Tembi clients have access to our Growth predictions and Size indication for free during July.
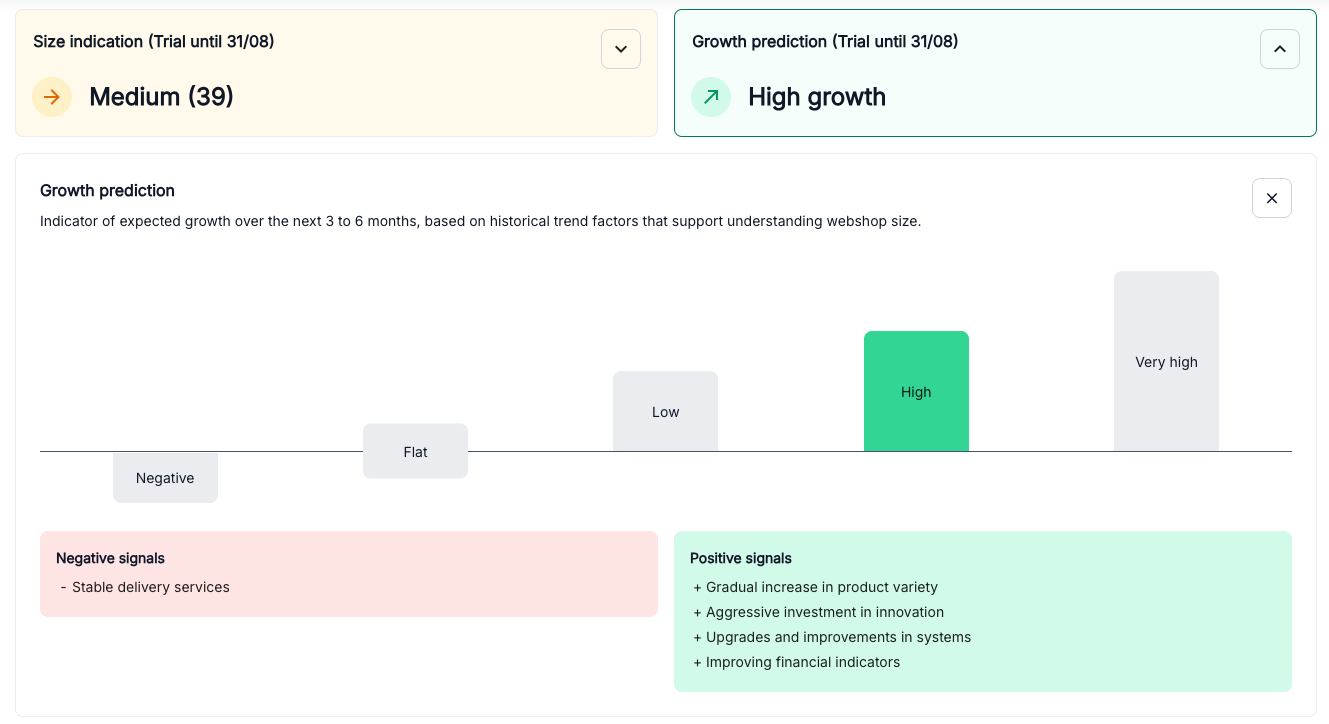
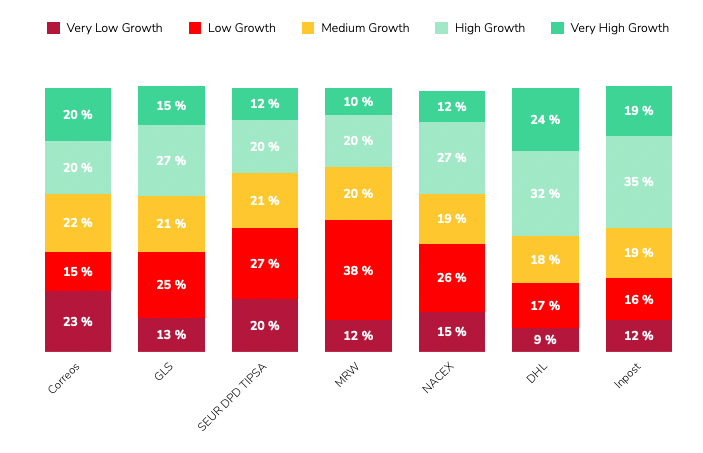
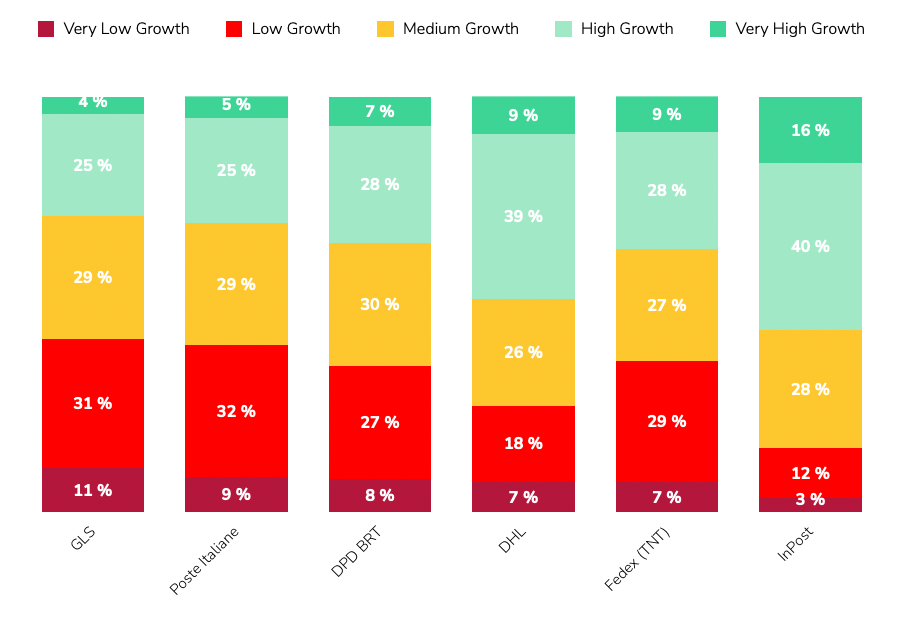
In business, knowledge is power, but foresight is transformational. Until now, most market intelligence relies on delivered reactive insights, offering clarity on the past or present but limited visibility into the future. Today, Tembi changes that by launching a groundbreaking predictive feature for e-commerce: Growth Predictions.
Why predictions matter
Understanding past performance is essential, but knowing what's coming next is where you truly gain a competitive advantage. With Growth Predictions, Tembi analyses hundreds of critical factors across hundreds of thousands of webshops, giving you a clear view of each retailer’s potential growth over the next 3 to 6 months.
How does it work?
Our unique predictive model evaluates comprehensive data points, including:
- Financial trends
- Employee growth and changes
- Product portfolio developments
- Web traffic insights (powered by SimilarWeb)
- Technological investments
- Infrastructure reliability
- Delivery partnerships and methods
- Category-specific trends
At the heart of this model is our proprietary AI-powered data collection methodology. For several years, we've meticulously collected, structured, and continuously updated vast datasets. Our advanced machine-learning algorithms use this rich historical data to identify patterns, learn from past behaviours, and generate precise, data-backed predictions. This ensures that our Growth Predictions aren’t guesses - they're calculated insights driven by robust AI techniques.
We translate these complex signals into straightforward, actionable insights, predicting whether a webshop will experience high growth, stability, or potential decline.
Transparent insights for smarter decisions
Growth Predictions don't just give you a simple score. They explain precisely why we anticipate certain growth patterns. For example:
- Positive growth signals: Stable infrastructure, Product portfolio expansion, added delivery methods or partners.
- Negative growth signals: Limited product portfolio expansion, insufficient technological investments.
This transparency helps you quickly understand the underlying strengths or vulnerabilities of any webshop.
Transform your commercial strategies
If you’re responsible for partnerships, sales, or logistics, Growth Predictions become your secret weapon. Prioritise your efforts, target the right segments and customers, optimise your resources, and proactively manage your commercial relationships by focusing on webshops that have a higher likeability to succeed.
First of its kind
No other e-commerce intelligence tool provides predictive growth insights at this depth. Using our unique dataset of retailers and product portfolios, we provide a comprehensive mapping of the e-commerce industry, helping companies plan strategically.
We update our dataset bi-weekly, ensuring teams can track prospects, provide insights and get a competitive advantage.
Interested in knowing more, book a demo with one of our experts.
Growth predictions are available for free as an early release during July for all our clients.
Today we’re rolling out Product Insights – a new tool that instantly breaks down the product catalogue of almost any webshop. By continuously monitoring 600,000 webshops and over 300 million products, Product Insights helps users find answers to questions that used to take days of manual work.

Understanding a retailer's product portfolio has always been a challenge – especially at scale. Tembi’s Product Insights structures each webshop’s catalogue based on Google’s product taxonomy (with over 2,000 sub-categories). Select a category, explore which sub-categories are sold, and get a clear view of the retailer’s product strategy.
Product Insights also lets you track trends over time. What categories are growing? Which brands are expanding? What product types are being phased out? With bi-weekly updates, your market understanding becomes sharper, faster, and far more granular than ever before.

Track product portfolio development
See exactly which brands a webshop sells, the total number of SKUs, and how they’re distributed across product categories. Our time-series view lets you pinpoint when a retailer expands or trims its range – whether that means adding 50 new kitchen appliances in March or dropping three footwear brands in May. Drill down by category or brand to understand growth spurts, assortment gaps, and strategic shifts at a glance.


Product weight and dimensions
Visualise a webshop’s entire catalogue by weight and dimensions in one interactive chart. The horizontal axis splits product prices into six bands; the vertical axis divides weights into six ranges. Each bubble’s size shows how many items fall into that combined bracket.

Track market trends
Go beyond individual retailers and tap into broader market movements. With Product Insights, you can zoom out and analyse how categories, brands, and product types are evolving across the entire e-commerce landscape in Europe (18 markets).
See which product categories are gaining momentum, what brands are expanding their reach, and how average product sizes or prices are shifting. Filter by country, industry or platform to spot changes in consumer demand, pricing trends, or assortment strategies.
Whether you're a brand manager trying to spot gaps, a logistics provider tracking shipping implications, or a buyer evaluating sourcing decisions – Product Insights turns market noise into clear, structured signals.
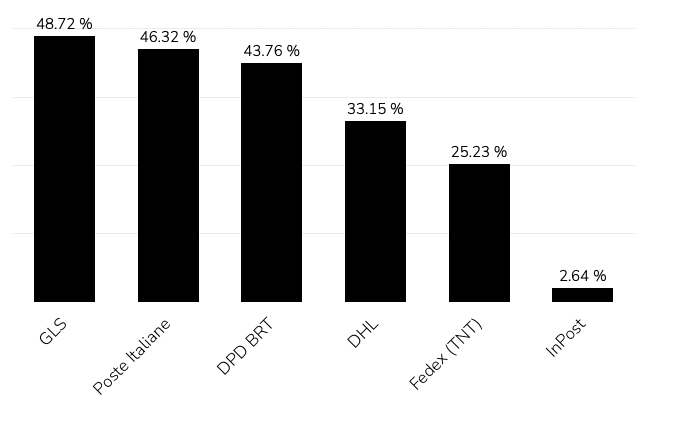
Discover and benchmark similar webshops
Instantly compare any retailer with others and uncover new prospects. Tembi’s Similar Webshops feature identifies other webshops with matching assortment structures, traffic levels, and category focus.

It’s a fast way to benchmark a client against competitors – or to find high-potential leads you might otherwise miss. Want to compare delivery providers across similar stores? Or find out how two apparel retailers differ in average price point and category spread? Just click “Full comparison” and dive into the details.
You can also scan for rising players in your segment. Use Similar Webshops to uncover up-and-coming stores with fast-growing assortments – perfect for partnership, outreach, or competitive monitoring.
Start exploring tomorrow
Product Insights is available now on Tembi. Whether you're tracking competitors, mapping out market shifts or sourcing prospects – the data you need is finally structured, searchable, and updated every two weeks.
Want to know more? Book a demo today!
Today we’re rolling out Product Insights – a new tool that instantly breaks down the product catalogue of almost any webshop. By continuously monitoring 600,000 webshops and over 300 million products, Product Insights helps users find answers to questions that used to take days of manual work.
Understanding a retailer's product portfolio has always been a challenge – especially at scale. Tembi’s Product Insights structures each webshop’s catalogue based on Google’s product taxonomy (with over 2,000 sub-categories). Select a category, explore which sub-categories are sold, and get a clear view of the retailer’s product strategy.
Product Insights also lets you track trends over time. What categories are growing? Which brands are expanding? What product types are being phased out? With bi-weekly updates, your market understanding becomes sharper, faster, and far more granular than ever before.
Track product portfolio development
See exactly which brands a webshop sells, the total number of SKUs, and how they’re distributed across product categories. Our time-series view lets you pinpoint when a retailer expands or trims its range – whether that means adding 50 new kitchen appliances in March or dropping three footwear brands in May. Drill down by category or brand to understand growth spurts, assortment gaps, and strategic shifts at a glance.
Product weight and dimensions
Visualise a webshop’s entire catalogue by weight and dimensions in one interactive chart. The horizontal axis splits product prices into six bands; the vertical axis divides weights into six ranges. Each bubble’s size shows how many items fall into that combined bracket.
Track market trends
Go beyond individual retailers and tap into broader market movements. With Product Insights, you can zoom out and analyse how categories, brands, and product types are evolving across the entire e-commerce landscape in Europe (18 markets).
See which product categories are gaining momentum, what brands are expanding their reach, and how average product sizes or prices are shifting. Filter by country, industry or platform to spot changes in consumer demand, pricing trends, or assortment strategies.
Whether you're a brand manager trying to spot gaps, a logistics provider tracking shipping implications, or a buyer evaluating sourcing decisions – Product Insights turns market noise into clear, structured signals.
Discover and benchmark similar webshops
Instantly compare any retailer with others and uncover new prospects. Tembi’s Similar Webshops feature identifies other webshops with matching assortment structures, traffic levels, and category focus.
It’s a fast way to benchmark a client against competitors – or to find high-potential leads you might otherwise miss. Want to compare delivery providers across similar stores? Or find out how two apparel retailers differ in average price point and category spread? Just click “Full comparison” and dive into the details.
You can also scan for rising players in your segment. Use Similar Webshops to uncover up-and-coming stores with fast-growing assortments – perfect for partnership, outreach, or competitive monitoring.
Start exploring tomorrow
Product Insights is available now on Tembi. Whether you're tracking competitors, mapping out market shifts or sourcing prospects – the data you need is finally structured, searchable, and updated every two weeks.
Want to know more? Book a demo today!
Not-Invented-Here Syndrome
How the Not-Invented-Here Syndrome can slow you down
In the early 2000s, Open Innovation emerged as a response to the Not-Invented-Here(NIH) Syndrome - a mindset particularly prevalent in engineering and IT organisations.Companies often preferred to build their own solutions rather than adopting existing ones, even when viable alternatives were readily available.
The rise of open innovation, open source, and open data has since accelerated technological progress for everyone. Instead of investing heavily in developing proprietary solutions, businesses can now leverage what already exists, saving time, money, and effort.
Why do companies still build their own solutions?
Despite these advancements, some businesses still choose to develop their own versions of existing solutions. The reasons often include:
- A belief that their needs are unique - assuming no existing solution will fully address their challenges.
- A desire for ownership and control - feeling that an in-house solution offers more flexibility or security.
However, these assumptions often lead to inefficiencies and long-term challenges.
Why reinventing the wheel can be a costly mistake
If a solution already exists in the market, trying to replicate it internally is rarely the best approach. Here’s why:
- Existing solutions are already optimised. Established providers continuously improve their products, meaning businesses benefit from ongoing innovation at a fraction of the cost.
- It’s more cost-effective. The upfront investment has already been made by others, allowing you to buy into a mature solution rather than funding development from scratch.
- Avoiding long-term technical debt. When you build your own solution, you’re responsible for maintenance, updates, and troubleshooting, costs that only increase over time. Dependence on internal teams or external consultants can create bottlenecks and slow progress.
The trap of sunk costs
Once a company has invested in a proprietary solution, it becomes difficult to abandon, even when it’s no longer efficient. This is how businesses end up with a giant with feet of clay, a fragile system that limits agility and innovation.
The Smarter Approach
Rather than building something from the ground up, focus on what differentiates your business. If a solution already exists in the market, build on top of it rather than duplicating efforts. The key to staying competitive isn’t in owning every piece of technology, it’s in leveraging the best tools available to drive your core business forward.


.png)


