

.png)


Act before the market

MIA is Tembi’s new agentic Market Intelligence Analyst for e-commerce: an AI-powered analyst that answers complex questions on e-commerce and last-mile delivery by analysing Tembi’s proprietary data from more than one million monitored webshops across Europe. It is built for commercial, strategy and product teams who need to see how markets, competitors and propositions are changing, without waiting for bespoke reports or building complex queries.

MIA turns Tembi’s market-scale e-commerce and last-mile data into something teams can interrogate in real time, not just receive in periodic reports. Instead of working around fixed dashboards, commercial, strategy and product teams can ask complex questions directly and see how markets, competitors and propositions are actually moving across Europe.
A typical workflow might start from a broad question like “Where have delivery propositions changed most in the last quarter?” and quickly narrow down to specific markets, segments or retailers. The analysis follows the question as it evolves, rather than forcing the question to fit a predefined view.
MIA acts like a market analyst orchestrated by a set of specialised AI agents that work directly on top of Tembi’s continuously monitored dataset of more than one million webshops across 23 European markets. When you ask a question, MIA is prompted with your query and an intent understanding agent interprets what you are really asking: the entities involved, the time horizon, the level of detail and the types of comparisons implied.
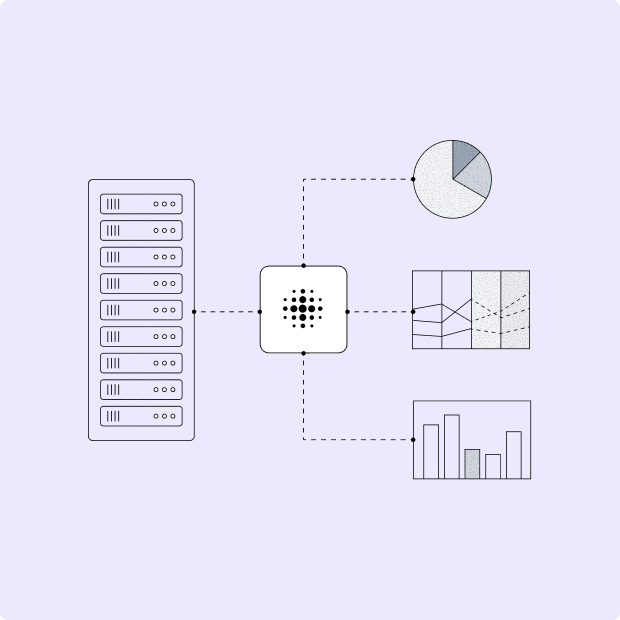
Based on that intent, MIA calls a data retrieval agent that knows how to navigate Tembi’s proprietary e-commerce and last-mile delivery data, select relevant retailers, markets, time periods and attributes, and assemble a fit-for-purpose dataset for the task. An analysis agent then applies appropriate methods – from simple aggregations and time series comparisons to mix shifts and provider presence views – and turns the results into structured outputs such as charts, graphs and allows users to build multi view dashboards that match the original question.
Throughout this process, MIA keeps the link between the analysis and the underlying data, so every result remains traceable back to specific retailers, webshops and time periods. If you need to validate or challenge a finding, you can move from an aggregate pattern (for example, “delivery options expanding in a given market”) down to the individual webshops that support that conclusion.
MIA follows the way analysts and commercial teams naturally work: start broad, refine, then package the results for others.
Read more about Agentic Analytics
MIA is possible because of Tembi’s underlying data foundation. Tembi continuously monitors more than one million European webshops and revisits each one roughly every two weeks to capture how assortments, brands, delivery methods, checkout setups and other attributes change over time.
That cadence turns e-commerce and last-mile delivery into a moving picture rather than a static snapshot. MIA brings an analyst layer on top of this, so instead of navigating raw complexity, teams can work with focused, question driven analysis that stays anchored in real, current market behaviour.
Explore an analysis of the Italian last-mile market done with MIA.
MIA is rolling out to selected Tembi customers from January 2026, with broader availability planned for March 2026. If your team works with e-commerce or last-mile delivery and wants analyst like access to Tembi’s market-scale data, you can register interest for early access on the MIA product page or by contacting Tembi at hello@tembi.io.
Interested in getting a demo, contact us and we'll set it up.
Spain counts 89,038 active online retailers, with clothes & shoes leading the category mix, an estimated +1,2bn parcels/year, and average delivery prices at €4,9 (home) vs €4,4 (OOH) for lightweight items. Our new Spain report maps the market structure, checkout dynamics, delivery methods, and how the main carriers compete for visibility - including the often-overlooked impact of white-label checkouts.
If you’re working in last-mile delivery and want a competitive view of Spain, download the full report here.
This report focuses on nine of the largest delivery providers in Spain: Correos / Correos Express, MRW, GLS, SEUR/DPD/Tipsa, DHL, NACEX, FedEx/TNT, CTT, and InPost/Mondial Relay. End-to-end retail & logistics operators (e.g., Amazon) and smaller/specialised operators (refrigerated, oversized, etc.) are intentionally excluded to keep the comparison clean and actionable.
All figures are based on Tembi’s continuous monitoring and analysis of Spanish online retailers and checkout setups, with consistent classification to support like-for-like analysis across markets. Use it to maintain competitive advantage, capture share in attractive segments, and understand market dynamics with clarity.
Quick takeaways
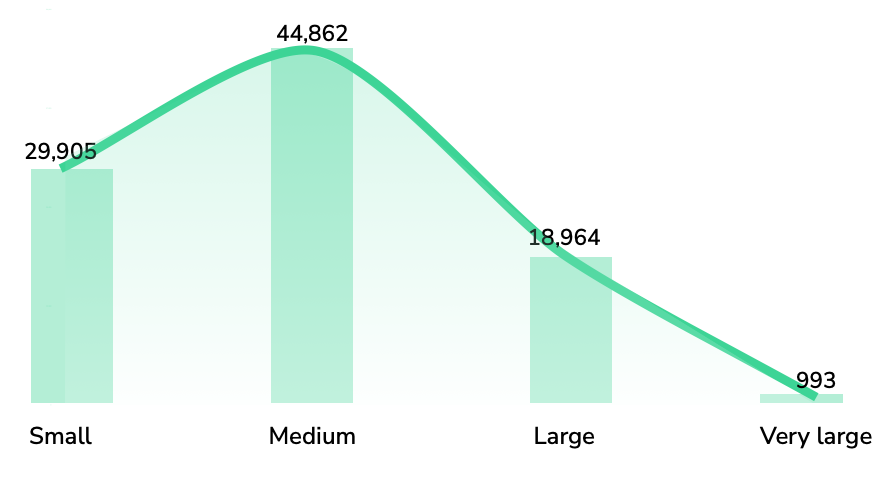
Spain is home to nearly 90,000 active online retailers, with a long tail that still produces meaningful parcel demand - and a smaller set of large/very large retailers that set service expectations (speed, returns, OOH availability, and delivery choice). Category-wise, Spain’s retailer base is led by clothes and shoes (~12,19%), followed by health & medicine (~7,04%) and beauty & personal care (~6,3%).

In Spain, share of presence (where a provider appears as an option in checkout) is heavily led by Correos / Correos Express, which shows up across ~41% of branded checkouts in our dataset, far ahead of the next tier (MRW, GLS, SEUR/DPD/Tipsa).
But presence is only half the story. In checkout, position matters.
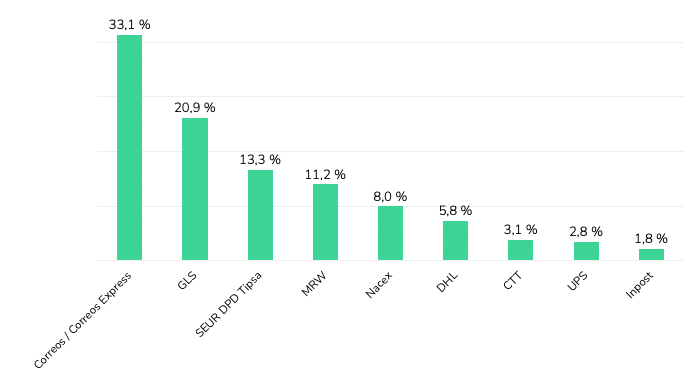
Across Spanish webshops where delivery provider brands are visible, Correos / Correos Express holds the first position most frequently (33,1%), followed by GLS (20,9%) and SEUR / DPD / Tipsa (13,3%). MRW (11,2%) and NACEX (8,0%) follow, with DHL (5,8%) and smaller shares for others.
If you read our Italy last-mile delivery analysis, you’ll recognise the same core idea: the checkout is the battlefield. The winners aren’t only those with the biggest networks - they’re the providers most consistently prioritised where consumers actually make the choice - why checkout position and visibility are a key differentiators in revenue and brand building.
Here is the uncomfortable truth for last-mile brands: a large share of Spanish retailers don’t show carrier names at all - they show only delivery methods and prices.
This matters because it means “market share” can look very different depending on whether you measure parcel volumes, merchant relationships, or brand visibility to consumers. For carriers, improving brand exposure inside white-label environments is one of the largest untapped levers in Spain - because it’s not a network problem, it’s a checkout/integration problem.

Across the market, home delivery is still the default, and the regulator view aligns with what we see in retailer setups: CNMC reports that in 2024 the usual delivery place was home (68,9%), with PUDO/convenience points (13,6%) and lockers (3,8%).
When we look at delivery methods displayed across retailers (excluding white-label checkouts), the same story holds: OOH is present, but underbuilt - especially compared to where Spain could go given consumer density and the cost-to-serve logic that OOH enables.
And pricing reinforces the direction of travel: for lightweight items, average delivery prices are roughly €4,9 (home) vs €4,3–€4,5 (OOH) depending on parcel shop vs locker. Spain is also cheaper than Italy across all options, which changes the “room” carriers have to subsidise adoption - but not the underlying incentive to densify OOH.

While retailers set the price shown in checkout, these figures consistently reflect provider positioning.

Not all “presence” is equal. The value of a provider’s retailer base depends on who those retailers are.
Using Tembi’s size scoring (0–100), we can see clear portfolio skews:

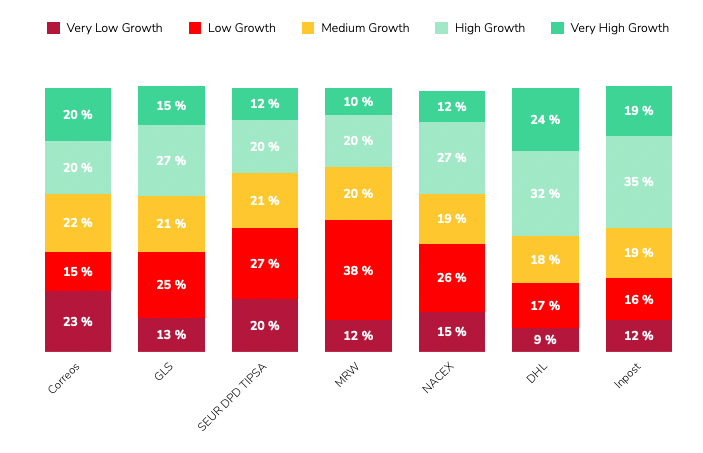
Category exposure shows the same idea from a different angle: providers aren’t just “generalists” - each ends up with a distinct category footprint (e.g., stronger concentration in health & medicine, fashion, electronics, etc.)
Finally, our Growth Indicator model adds a forward-looking layer: DHL and InPost have the strongest growth-weighted portfolios, with 56% and 54% of their clients forecast to be in high or very high growth bands. Correos shows a more balanced mix across growth bands.
If you want the practical “so what” for Spain, three things stand out:
Spain’s last-mile market is large, competitive, and still structurally under-optimised in checkout. Correos dominates branded presence and first-position frequency, white-label checkouts hide a big part of the market, and OOH remains a clear runway - with meaningful differences in portfolio quality and growth potential across providers.
Download the full Spain report, or schedule a Tembi demo to see your competitive landscape updated continuously across markets - including comparisons to our Italy analysis
Italy counts 94,724 online retailers, with clothing, groceries and beauty leading the mix, average home delivery cost at €6.5 and OOH at €5.8. With continued investment and InPost’s strong market entry, OOH delivery is expanding rapidly and reshaping the competitive landscape. This Italian last-mile delivery market analysis maps the structure, methods and provider portfolios behind the numbers.
Working in last-mile delivery and interested in another competitive market analysis beyond Italy? Let's connect. Download the full report here.
Italy remains one of Europe’s most active e-commerce markets by merchant count and parcel flow. To help last-mile executives benchmark strategy, this report profiles the market composition, delivery method availability and pricing, and the competitive landscape across six core providers: GLS, Poste Italiane, DPD BRT, DHL, InPost, and FedEx (TNT). You’ll see where demand concentrates by category, how pricing positions each method, and how provider client portfolios skew by retailer size and expected growth.
All figures are derived from Tembi’s continuous monitoring and analysis of Italian online retailers and checkout setups, with consistent taxonomy and normalisation to support like-for-like comparisons. Use it to maintain competitive advantage, capture share in attractive segments, and understand market dynamics with clarity.
Quick takeaways
Italy’s 94,724-strong retailer base skews to clothes & shoes (≈12.1%), then food & groceries (≈6.7%), and beauty (≈5.4%). The size pyramid shows most merchants are medium, fewer large, and about 1% very large, indicating a wide long-tail with concentrated head accounts that influence parcel mix and service expectations. The latest available data from 2020 suggest that around 830 million parcels are shipped domestically each year. Given the latest e-commerce growth estimation of an average annual growth rate of 4.5%, parcel volumes could now be approaching one billion shipments.
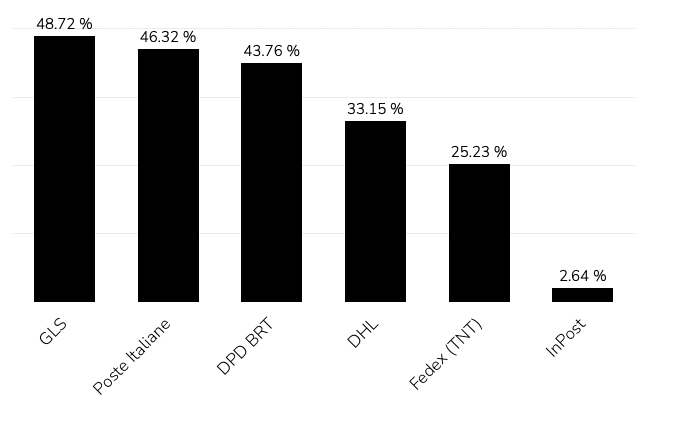
GLS and Poste Italiane hold the broadest presence across Italian webshops - GLS appears in 48.7% of retailer checkouts and Poste Italiane in 46.3%. DPD BRT, DHL, InPost, and FedEx (TNT) follow, forming the rest of the competitive landscape.
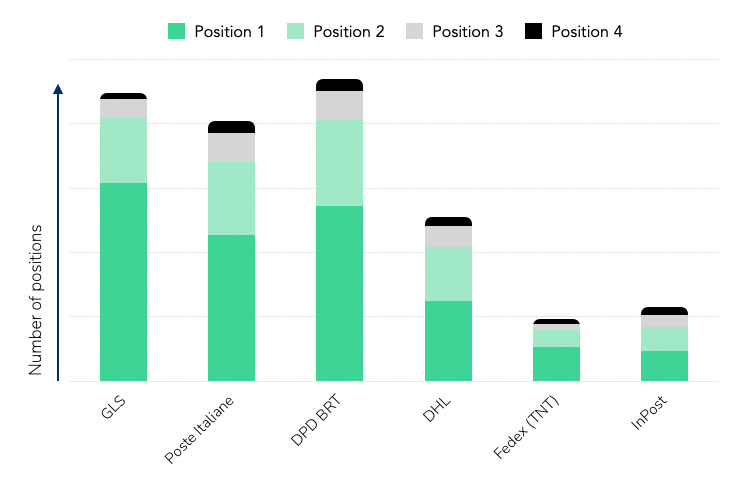
When looking at the first delivery option offered to shoppers, GLS leads with roughly 30%, followed by DPD BRT (26%) and Poste Italiane (22%).This ordering pattern reflects how retailers prioritise providers based on network reach, reliability, and negotiated terms rather than pure visibility.

In short:
Across Italian retailers, home delivery remains dominant, offered by roughly 89% of webshops. Parcel shops (≈9%) and parcel lockers (≈3%) are still at an early stage of rollout, but both formats are expanding as networks and integrations mature.
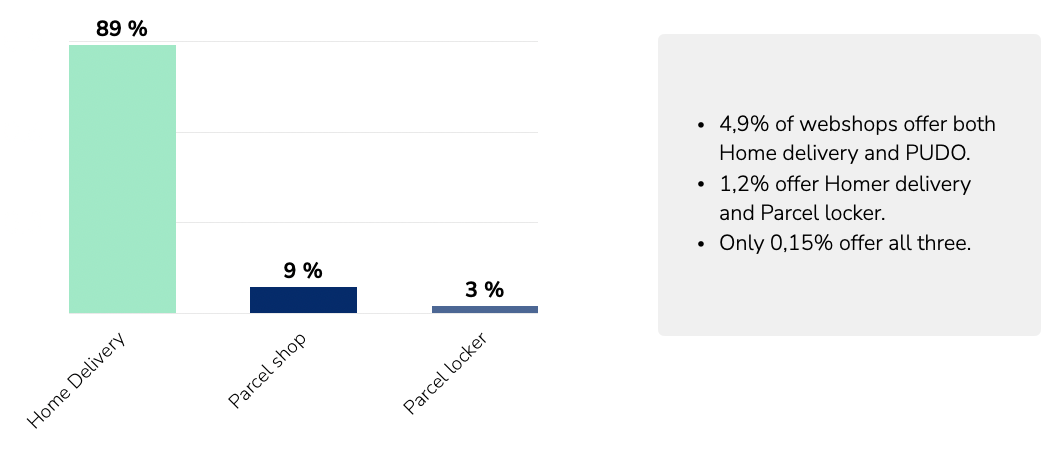

The limited share of OOH options reflects the market’s current infrastructure capacity rather than consumer demand alone. With continued investment from providers such as InPost, Poste Italiane, and DPD BRT, OOH coverage is expected to increase steadily over the next few years, giving retailers broader flexibility in how they structure delivery choices and costs.
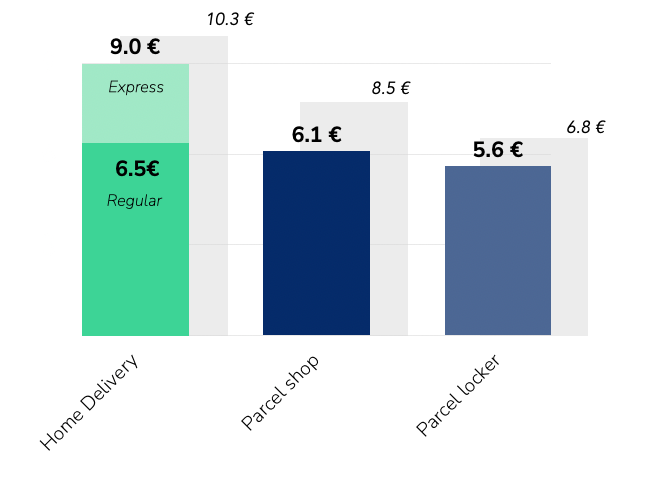
Pricing across delivery methods follows a clear hierarchy. Home delivery is the most expensive, with DHL and FedEx (TNT) positioned at the higher end in line with their express and international focus.GLS, Poste Italiane, and DPD BRT sit around the market average, reflecting large-scale domestic coverage and standardised pricing structures. InPost maintains the lowest price levels across OOH deliveries, consistent with its parcel-locker model and high network density.
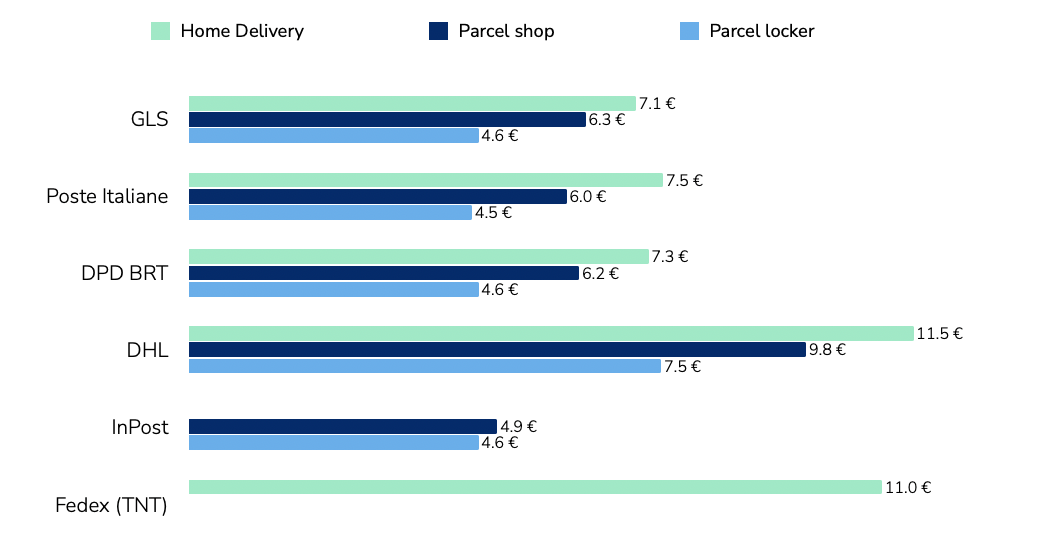
The pricing gap between home and OOH - €6.5 vs €5.8 on average - highlights the economic rationale for providers to keep expanding out-of-home capacity, and in line with most other markets. As networks grow denser, these price differences will continue to influence retailer delivery mix.
Tembi’s analysis segments retailer clients by size and growth outlook, showing how each provider’s portfolio is positioned across the Italian market.
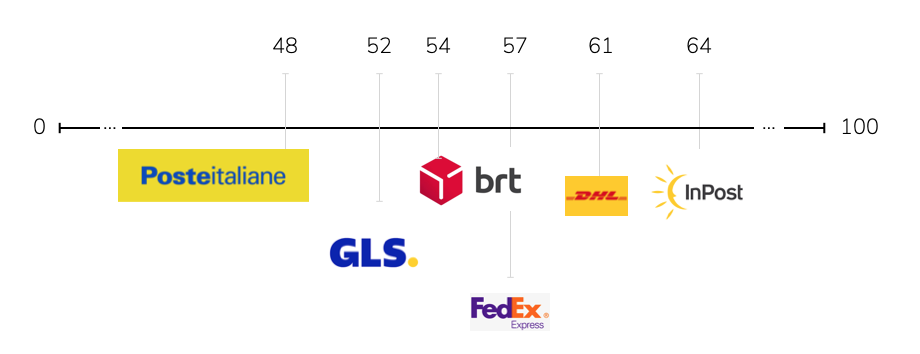
This chart summarises the average retailer size of each provider’s client base on Tembi’s 0–100 scale, where higher scores represent larger and more established webshops.

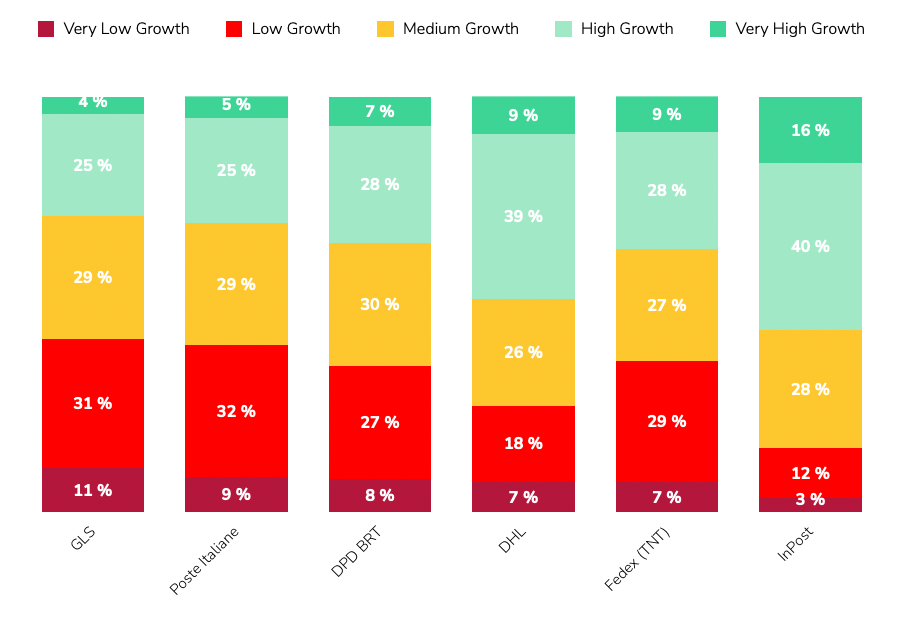
The stacked bars show how each delivery provider’s clients are distributed by retailer size:
Using Tembi’s forward-looking Growth Indicator - a composite of product portfolio development, traffic momentum, financial proxies, and export activity - InPost has the highest share of high- and very-high-growth retailers, reflecting its alignment with fast-scaling digital merchants. DHL also skews towards higher-growth segments, supported by its express and cross-border strengths. Meanwhile, GLS, Poste Italiane, and DPD BRT hold proportionally larger bases of mature retailers, providing stability and recurring parcel volume.
Locker and parcel shop networks are entering a phase of rapid expansion across Italy.InPost leads with more than 3,000 lockers installed at the start of 2025. DHL and Poste Italiane jointly reported around 500 lockers by mid-2025, alongside an ambitious plan to reach 10,000 units in the coming years. DPD BRT, through its Fermopoint network, aims for up to 4,000 lockers within five years, while GLS initiated its own rollout during 2025.
This coordinated investment places Italy on a clear multi-year OOH growth trajectory, reshaping how carriers balance cost, capacity, and customer reach. The build-out is not just a convenience upgrade; it’s a structural shift in network economics - each new locker or parcel shop reduces last-mile cost per parcel and expands delivery capacity in urban areas.
Why it matters
Rising locker and parcel shop density directly influences:
As the network matures, OOH will become a central component of Italy’s last-mile infrastructure, shaping both consumer choice and carrier efficiency.
Tembi’s analysis highlights three practical dimensions that matter for market strategy and portfolio alignment.
1. Segment by retailer size and category
Italy’s retailer landscape is dominated by small and medium merchants, but larger and premium-category retailers - such as fashion, beauty, and consumer electronics - set higher expectations for service speed, reliability, and returns. Delivery providers should align SLAs, OOH coverage, and returns management to match those standards while maintaining efficient access to the long tail.
2. Model the price–mix effect
With home delivery averaging €6.5 and OOH €5.8, even a modest shift in checkout mix can materially improve cost-to-serve for both carriers and retailers. Tracking these dynamics by category and region helps identify where OOH incentives or dynamic checkout sequencing can achieve measurable margin impact.
3. Track portfolio momentum
Provider client portfolios differ in growth exposure. InPost and DHL are more concentrated among high-growth retailers, while GLS, Poste Italiane, and DPD BRT anchor the market’s stable core. Monitoring these shifts over time helps providers balance predictable SMB volume with faster-growing digital retailers, ensuring coverage across both maturity extremes.
Italy’s last-mile market is broad, price-competitive, and evolving. Method economics continue to favour OOH expansion as networks densify; provider portfolios show divergent exposures across retailer size and growth; and the locker build-out marks a long-term structural transformation rather than a short-term initiative.
This Italian last-mile delivery market analysis outlines the market map and comparative signals needed to inform planning, benchmarking, and partnership strategies across the sector.
Download the full Italian market report or schedule a Tembi demo to see your competitive view updated continuously.
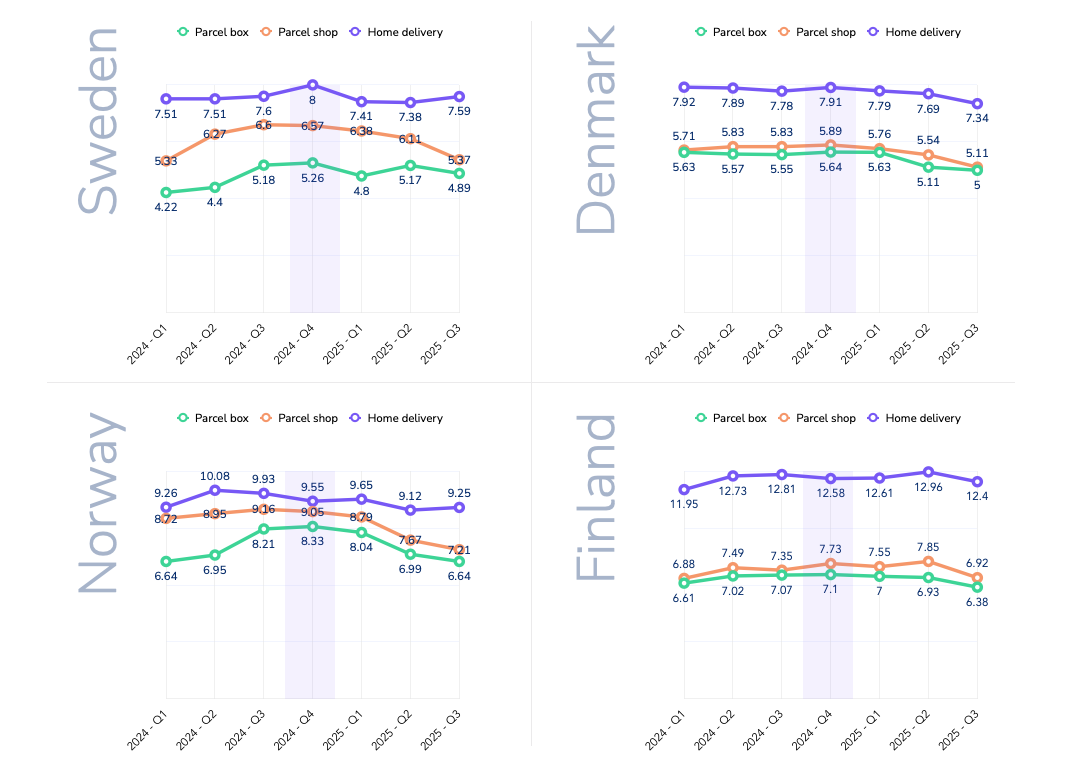
Delivery fees across the Nordics have followed clear seasonal patterns and strategic adjustments over the past two years. Drawing on data from over100,000 webshops in Sweden, Denmark, Finland, and Norway between Q1 2024 and Q32025, we track how average consumer delivery prices (in EUR) have shifted.
This analysis zooms in on the Q4 holiday peak, highlights country-specific behaviours, and compares delivery methods in urban areas - parcel lockers, pickup points, and home delivery. The aim is to show how webshops shape their pricing strategies and how these evolve through the year.

Seasonality is a defining feature of delivery pricing in the Nordics. Q4, the peak holiday quarter, typically brings stable or higher fees rather than discounts. In late 2024, Black Friday and Christmas did not lead to cheaper delivery - instead, many webshops kept prices firm or lifted them slightly.
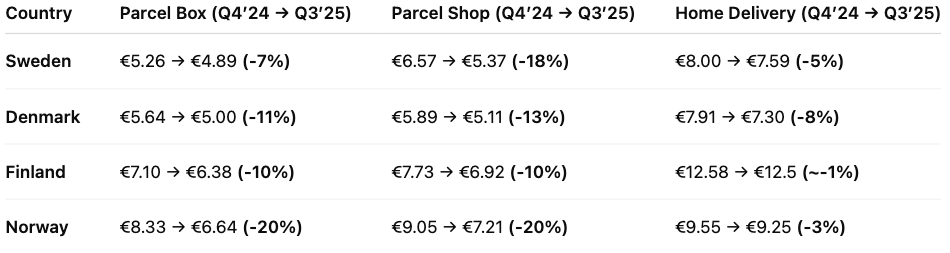
· Sweden: average home delivery rose from €7.60 in Q3 2024 to €8.00 in Q4, the annual peak.
· Denmark: small increases, such as parcel shop delivery at €5.89 in Q4 versus €5.83 inQ3.
· Finland: parcel shop fees jumped by around 5% in Q4 2024.
· Norway: parcel box delivery peaked during the holiday quarter.
The pattern suggests that in high-demand Q4, retailers prioritise covering fulfilment costs over cutting fees - even when running heavy sales campaigns.
This shifts in Q1, when prices correct downward. After the holiday rush, many webshops reduced or normalised fees:
This Q1 softness reflects the post-holiday slowdown in demand and renewed competition to attract consumers during a quieter season.
Q4 2024 stands out as a high point for delivery fees in several markets, corroborating that peak season surcharges and fewer free-shipping promos were in effect. In fact, during Black Week (Black Friday 2024), retailers across Noridcs reduced the prevalence of free shipping by 4% compared to 2023, opting instead to set spend thresholds or promote premium paid options (source: ingrid.com). In other words, fewer orders enjoyed “free delivery” in Q4 2024, as merchants nudged customers toward paid faster delivery or order bundling.This strategic move helped protect margins during the holiday boom – and consumers generally went along, paying for delivery when the value (speed, convenience) was clear (source: ingrid.com). The seasonal insight here is that peak demand doesn’t equal cheaper shipping; if anything, many webshops use the period to upsell premium delivery or maintain prices, rather than offer blanket free shipping.
Moving through 2025, the Q2 and Q3 2025 data show an interesting reset. By summer 2025, average delivery charges in many categories fell back to or below their levels from the previous holiday season. This sets the stage for how Q4 2025 might play out – which we’ll discuss in a moment.
Each Nordic market shows distinct pricing dynamics, shaped by competition, consumer behaviour, and delivery costs.
Swedish webshops consistently post the lowest delivery fees in the region.In early 2024, prices were modest - around €4.20 for locker delivery and €7.50 for home delivery. These rose steadily through the year, with parcel box and parcel shop deliveries more than 20% higher by Q3/Q4. Home delivery peaked at €8.00 in Q42024, reflecting inflationary pressures and webshop/carriers passing higher rates on to consumers.
In 2025, the trend reversed. By Q3 2025, parcel shop delivery had dropped from €6.57 in Q4 2024 to €5.37 (an 18% decline),while home delivery eased back to €7.59. This points to intensifying competition, with Swedish retailers willing to cut delivery prices quickly to gain an edge.
Denmark’s delivery pricing remained stable through 2024, with parcel lockers and pickup points in the mid-€5 range and home delivery around €7.80–7.90. Even in Q4, increases were marginal- for example, parcel shop delivery at €5.89 in Q4 versus €5.83 in Q3.
The shift came in 2025. By Q3, parcel lockers averaged €5.00 and parcel shops €5.11 - 10–13% lower than the prior holiday season. Home delivery also dipped to €7.30 from €7.91 in Q4 2024. This gradual decline suggests Danish webshops began competing more actively on delivery price or carriers pressed the prices further down.
Finland remains the most expensive Nordic market for delivery - especially for home delivery. In 2024, Finnish shoppers paid €12–13 for home delivery, nearly double Sweden’s average. Out-of-home methods were also high at €7+. Prices climbed steadily through 2024, with parcel shops up 12% by Q4.
In 2025, home delivery crept even higher, peaking at €12.90 in Q2. But by Q3, parcel locker and shop fees had fallen sharply - down about 10% from Q2, back to early-2024 levels. Home delivery stabilised around€12.50.
Norway experienced the most pronounced swings. In 2024, home delivery peaked at €10.08 in Q2, while parcel lockers (€8.21) and parcel shops (€9.16) hit highs in Q3. Interestingly, Q4 home delivery was lower than earlier in the year at €9.55.
By 2025, Norwegian webshops had cut prices heavily, especially for out-of-home delivery. Parcel lockers fell from over €8in late 2024 to €6.64 by Q3 2025- a 20% year-on-year drop. Parcel shop delivery followed a similar pattern, down about €1.20 on average versus Q4 2024. Home delivery also eased slightly to €9.25 by Q3.
The widening price gap between home and pickup options suggests a deliberate push to shift volume to more cost-efficient methods. For carriers, Norway highlights how quickly competitive conditions can change - and the need to adjust pricing strategies in real time.
To summarize the country trends, Table 1 highlights how delivery fees in Q3 2025 compare to the last peak season (Q42024). Most markets saw notable declines in that period, especially for out-of-home deliveries:
Data clearly shows that out-of-home delivery is significantly cheaper for consumers in urban areas – a natural effect when carriers can deliver 5–10 times more parcels per driver compared with home delivery.
Parcel box (locker) delivery
· Cheapest option across all markets by 2025(~€5–6.5).
· Prices spiked in 2024 (e.g. Norway €6.6 → €8.3)but dropped back sharply in 2025.
· Volatility suggests retailers test price sensitivity, then reset as competition kicks in.
Parcel shop(pickup point) delivery
· Typically a few cents above lockers, but fell notably in 2025.
· Norway: from ~€9 in 2024 to €7.2 by Q3 2025.
· Pricing gap with home delivery widened, creating strong incentives for consumers to choose pickup.
Home delivery
· Premium service, consistently the most expensive.
· Held steady through 2024–25: ~€7.5 in SE/DK,~€9.3 in NO, ~€12.5 in FI.
· Only small price drops, with Sweden (-13% YoY)the exception.
· Discounts remain rare and tied to high order values.
Out-of-home delivery became cheaper in 2025, while home delivery kept its premium. This reflects a conscious decision: steer demand towards lockers and pickup points to cut last-mile costs and ease peak-season pressure. Black Week 2024 showed the effect in practice - locker usage rose by four percentage points and delivery times improved as shoppers embraced flexible collection (source: ingrid.com).
For logistics providers and retailers, aggressive pricing on out-of-home delivery seems to become a core lever: it nudges cost-conscious consumers, reduces operational strain, while keeping satisfaction high. But the gap has limits - home delivery still anchors convenience expectations and remains a profit lever. The real challenge is balance: keeping lockers and pickups highly attractive without eroding the value or accessibility of home delivery.
Collaboration between retailers and logistics providers is key here, ensuring service levels meet expectations as more customers choose out-of-home - seen clearly during Black Week, when lockers not only gained share but also delivered faster on average (source: ingrid.com).
To keep the forecast transparent, we applied a simple model: for each country × delivery method, we took the Q4-over-Q3 seasonal change from 2024 and applied that ratio to Q3 2025 levels. Where 2025 trended lower than 2024, we also include a conservative midpoint between Q3 2025 and that baseline.
· Parcel box(lockers): €5.6–6.0
· Parcel shop(pickup): €6.1–6.3
· Home delivery: €9.0–9.2
Seasonal lift from Q3 to Q4 looks modest. Home delivery remains the premium option, while lockers and parcel shops stay clearly cheaper.
· Sweden: home ~€8.0 (flat vs last year); parcel shop ~€5.3 and lockers ~€5.0 (well below last year).
· Denmark: home ~€7.4; parcel shop ~€5.2; lockers ~€5.1 (all lower than last year).
· Finland: home ~€12.5 (still high); parcel shop ~€7.3; lockers ~€6.4 (both down year-on-year).
· Norway: home ~€9.25 (slightly below last year); parcel shop ~€7.1; lockers ~€6.7 (~20%down year-on-year).
Nordic delivery prices have eased through 2025 after peaking in late 2024, especially for out-of-home options (parcel box and parcel shop). Applying last year’s Q4-over-Q3 seasonality to current Q3 levels points to only small Q4 uplifts: lockers and pickups remain the low-cost choices, while home delivery stays premium and broadly flat.
Country patterns matter. Sweden and Denmark have lower 2025 bases and limited room for Q4 increases. Finland remains structurally high - especially on home delivery - so stability is more likely than hikes. Norway has corrected sharply this year, with retailers continuing to nudge volume toward cheaper lockers and pickups.
The underlying pricing strategies are clear:
· Continued shift to out-of-home delivery. Lower pricing here is deliberate - directing volume away from costly home delivery and easing last-mile strain.
· Home delivery as a premium anchor. Price cuts are modest; competition is about service quality (slots, ETAs, first-attempt success) rather than cents.
· Seasonal resets. After Christmas, prices ease in Q1—a cycle webshops use to stay competitive in slower months.
Finally, weigh this outlook against external factors that can quickly shift the picture: capacity constraints and consumer sentiment. If sentiment weakens, retailers may lean harder on thresholds and targeted incentives.
For most companies, two questions matter when looking at the e-commerce market: which webshops will grow and how large they are today. These are not easy to answer. Financial accounts are published once a year and often with long delays. Website traffic tools vary in accuracy. Sales input can be useful, but it is not consistent across markets.
Tembi approaches the problem differently. We track over 800.000 webshops in 22 European markets, visiting them every two weeks, and we convert that activity into a clear view of current size and likely growth.
From this data, we produce two measures.
Together, these outputs give a comparable and timely view of the market that has not been available before.
What makes this possible is the breadth of signals we collect. Every webshop is assessed on seven main areas:
It is the combination of these factors, updated every two weeks, that produces a reliable picture of both size and growth.
Older approaches depend on delayed filings, unstable traffic estimates, or anecdotal sales input. They describe the past, not the present. By contrast, Tembi provides a structured, repeatable model that updates with the market itself. A Danish fashion webshop and a Spanish electronics retailer can be measured on the same scale, and shifts in momentum can be detected months before they appear in official reports.
This is not prediction for prediction’s sake. It is about replacing guesswork with evidence that is current, structured and comparable.
Tembi provides a way to see the market as it develops — which webshops are growing, how large they are, and where categories are shifting. It offers the clarity needed to make decisions with confidence, based on how the market is moving today.
Growth predictions and Size estimation are available on all markets Tembi has been active on for more then three months.
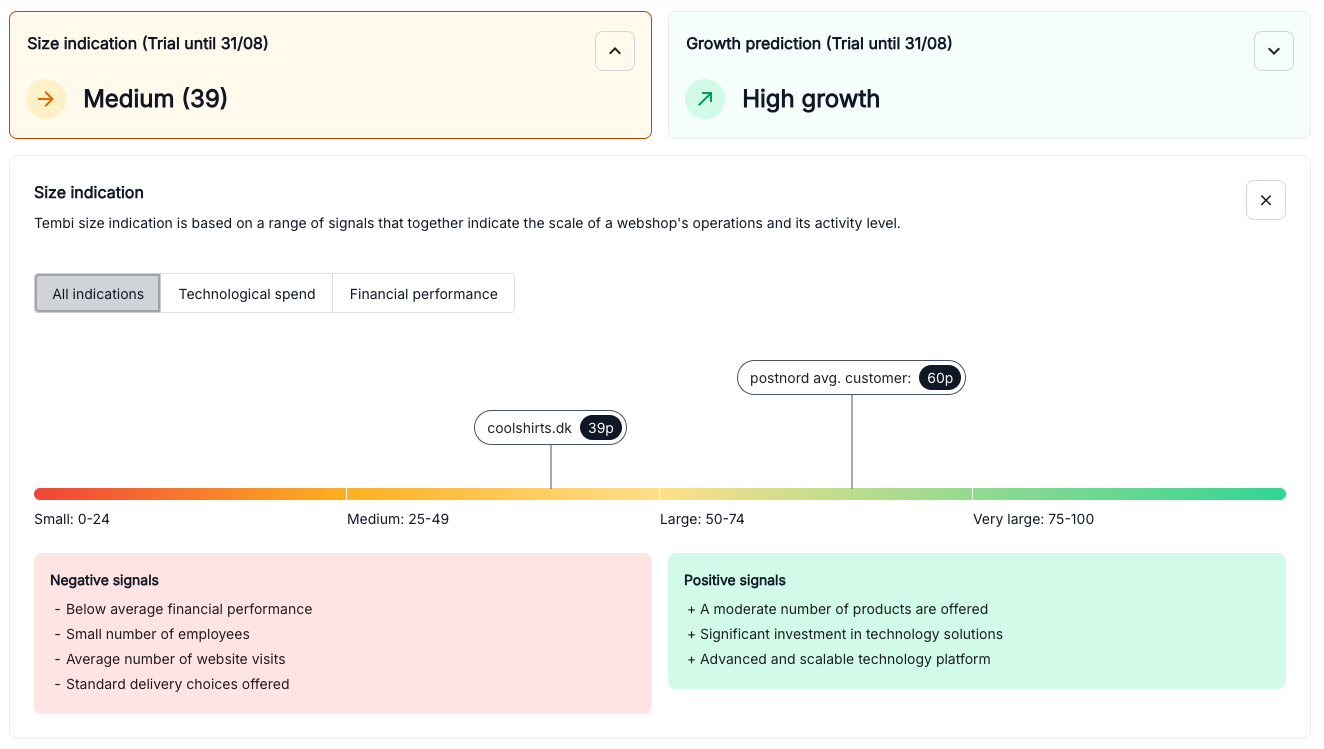
Knowing which webshops to focus on helps your business succeed. That’s why we've launched Tembi’s Size indication, a simple way to quickly understand how active and big (or small) any webshop is in the market compared to the largest online retailers.
What is the Size indication?
Tembi’s Size indications scores webshops from 1 to 100 points, dividing them into clear groups:
This makes it easy to compare webshops and see where they stand compared to others.
How does it work?
The Size indication uses hundreds of data points per webshop to decide each webshop’s score, including:
These factors, and many more, provide a clear picture of how active and large a webshop is. Each webshop’s score is clearly explained, showing both positive and negative factors.
Why the Size indication is useful
The Size indication makes market analysis simpler. You can quickly assess market size and find webshops that fit your ICP. When looking at thousands of prospects, Size indication allows you to sort all webshops, and see their size in relation to each other.
Combine Size indication with Growth Predictions
Tembi’s Size indication works hand-in-hand with our Growth Predictions feature. By combining these insights, you get a complete view of the market opportunity - clearly identifying which webshops are not only large and active but also likely to grow. This powerful combination helps you pinpoint the best opportunities for strategic action and growth.
Want to get started?
Log in to Tembi and check out the Size indication now. All Tembi clients have access to our Growth predictions and Size indication for free during July.
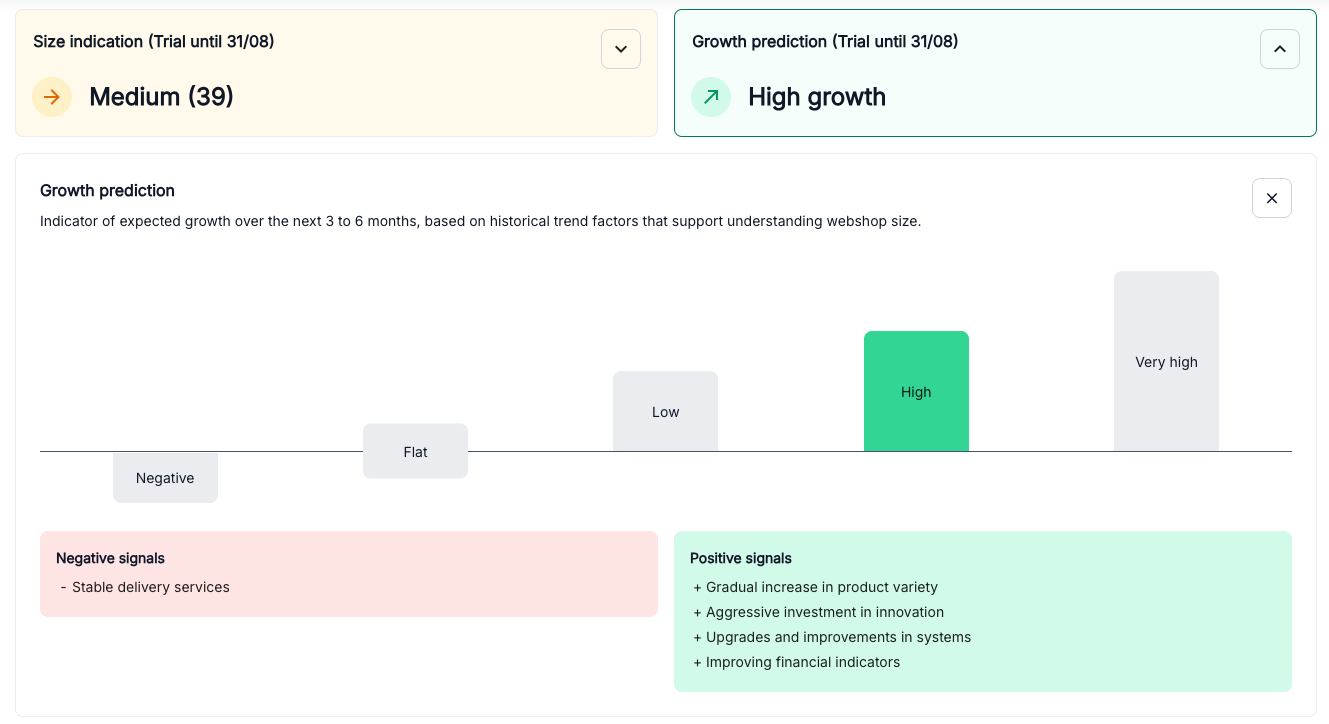
In business, knowledge is power, but foresight is transformational. Until now, most market intelligence relies on delivered reactive insights, offering clarity on the past or present but limited visibility into the future. Today, Tembi changes that by launching a groundbreaking predictive feature for e-commerce: Growth Predictions.
Why predictions matter
Understanding past performance is essential, but knowing what's coming next is where you truly gain a competitive advantage. With Growth Predictions, Tembi analyses hundreds of critical factors across hundreds of thousands of webshops, giving you a clear view of each retailer’s potential growth over the next 3 to 6 months.
How does it work?
Our unique predictive model evaluates comprehensive data points, including:
At the heart of this model is our proprietary AI-powered data collection methodology. For several years, we've meticulously collected, structured, and continuously updated vast datasets. Our advanced machine-learning algorithms use this rich historical data to identify patterns, learn from past behaviours, and generate precise, data-backed predictions. This ensures that our Growth Predictions aren’t guesses - they're calculated insights driven by robust AI techniques.
We translate these complex signals into straightforward, actionable insights, predicting whether a webshop will experience high growth, stability, or potential decline.
Transparent insights for smarter decisions
Growth Predictions don't just give you a simple score. They explain precisely why we anticipate certain growth patterns. For example:
This transparency helps you quickly understand the underlying strengths or vulnerabilities of any webshop.
Transform your commercial strategies
If you’re responsible for partnerships, sales, or logistics, Growth Predictions become your secret weapon. Prioritise your efforts, target the right segments and customers, optimise your resources, and proactively manage your commercial relationships by focusing on webshops that have a higher likeability to succeed.
First of its kind
No other e-commerce intelligence tool provides predictive growth insights at this depth. Using our unique dataset of retailers and product portfolios, we provide a comprehensive mapping of the e-commerce industry, helping companies plan strategically.
We update our dataset bi-weekly, ensuring teams can track prospects, provide insights and get a competitive advantage.
Interested in knowing more, book a demo with one of our experts.
Growth predictions are available for free as an early release during July for all our clients.
How a Last-Mile delivery commercial team used Tembi to reach online retailers when they were most likely to engage.
A last mile delivery provider was looking to improve how and when they approached new merchant prospects. While they had a solid understanding of who they wanted to work with, outreach often happened too early (before the merchant was ready to switch) or too late (after a competitor had locked in a contract).
Without visibility into what was changing in the merchant’s checkout, reps had to rely on cold outreach, hoping to catch a merchant at the right moment. They needed a way to:
Using Tembi Checkout Intelligence, the team started monitoring live changes in merchant checkout configurations. Tembi scrapers simulate checkout flows on thousands of webshops and detect:
The team set up biweekly alerts on merchants that matched their ICP and showed recent changes in their delivery stack. This created a dynamic feed of prospects likely to be re-evaluating logistics partners, so an ideal timing for outreach.
The team didn’t need to chase every webshop in a market. Instead, they focused on high-potential accounts showing signs of change. Over a six-week period, they:
Timing their approach based on real signals helped them avoid wasted effort and start conversations when interest was highest.
✅ Actionable timing signals was more effective than cold outreach
✅ Changes tracked automatically from actual checkout flows
✅ Focus on merchants in motion who are more likely to convert
✅ Fewer dead ends - reps only acted when there was a reason to reach out


