
.png)

Act before the market
Spain counts 89,038 active online retailers, with clothes & shoes leading the category mix, an estimated +1,2bn parcels/year, and average delivery prices at €4,9 (home) vs €4,4 (OOH) for lightweight items. Our new Spain report maps the market structure, checkout dynamics, delivery methods, and how the main carriers compete for visibility - including the often-overlooked impact of white-label checkouts.
If you’re working in last-mile delivery and want a competitive view of Spain, download the full report here.
This report focuses on nine of the largest delivery providers in Spain: Correos / Correos Express, MRW, GLS, SEUR/DPD/Tipsa, DHL, NACEX, FedEx/TNT, CTT, and InPost/Mondial Relay. End-to-end retail & logistics operators (e.g., Amazon) and smaller/specialised operators (refrigerated, oversized, etc.) are intentionally excluded to keep the comparison clean and actionable.
All figures are based on Tembi’s continuous monitoring and analysis of Spanish online retailers and checkout setups, with consistent classification to support like-for-like analysis across markets. Use it to maintain competitive advantage, capture share in attractive segments, and understand market dynamics with clarity.
Quick takeaways
Spain is home to nearly 90,000 active online retailers, with a long tail that still produces meaningful parcel demand - and a smaller set of large/very large retailers that set service expectations (speed, returns, OOH availability, and delivery choice). Category-wise, Spain’s retailer base is led by clothes and shoes (~12,19%), followed by health & medicine (~7,04%) and beauty & personal care (~6,3%).

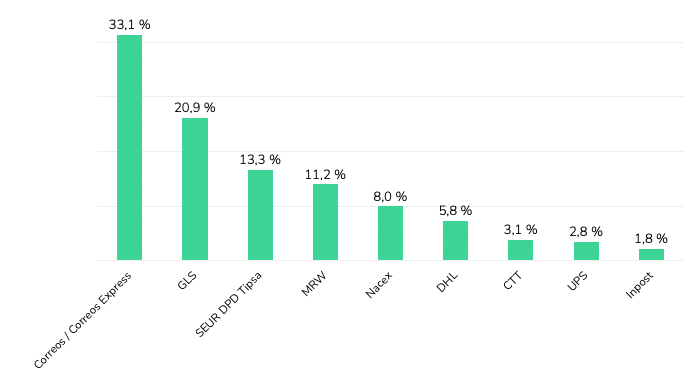
In Spain, share of presence (where a provider appears as an option in checkout) is heavily led by Correos / Correos Express, which shows up across ~41% of branded checkouts in our dataset, far ahead of the next tier (MRW, GLS, SEUR/DPD/Tipsa).
But presence is only half the story. In checkout, position matters.
Across Spanish webshops where delivery provider brands are visible, Correos / Correos Express holds the first position most frequently (33,1%), followed by GLS (20,9%) and SEUR / DPD / Tipsa (13,3%). MRW (11,2%) and NACEX (8,0%) follow, with DHL (5,8%) and smaller shares for others.
If you read our Italy last-mile delivery analysis, you’ll recognise the same core idea: the checkout is the battlefield. The winners aren’t only those with the biggest networks - they’re the providers most consistently prioritised where consumers actually make the choice - why checkout position and visibility are a key differentiators in revenue and brand building.
Here is the uncomfortable truth for last-mile brands: a large share of Spanish retailers don’t show carrier names at all - they show only delivery methods and prices.
This matters because it means “market share” can look very different depending on whether you measure parcel volumes, merchant relationships, or brand visibility to consumers. For carriers, improving brand exposure inside white-label environments is one of the largest untapped levers in Spain - because it’s not a network problem, it’s a checkout/integration problem.

Across the market, home delivery is still the default, and the regulator view aligns with what we see in retailer setups: CNMC reports that in 2024 the usual delivery place was home (68,9%), with PUDO/convenience points (13,6%) and lockers (3,8%).
When we look at delivery methods displayed across retailers (excluding white-label checkouts), the same story holds: OOH is present, but underbuilt - especially compared to where Spain could go given consumer density and the cost-to-serve logic that OOH enables.
And pricing reinforces the direction of travel: for lightweight items, average delivery prices are roughly €4,9 (home) vs €4,3–€4,5 (OOH) depending on parcel shop vs locker. Spain is also cheaper than Italy across all options, which changes the “room” carriers have to subsidise adoption - but not the underlying incentive to densify OOH.

While retailers set the price shown in checkout, these figures consistently reflect provider positioning.

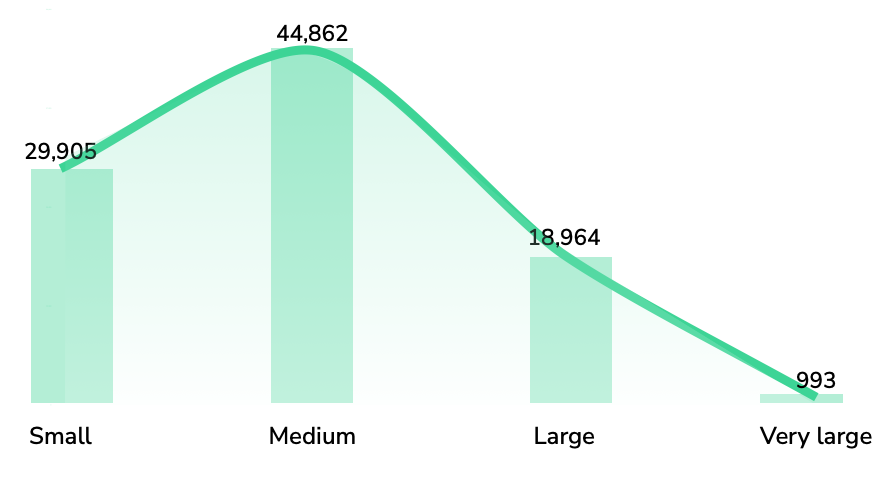
Not all “presence” is equal. The value of a provider’s retailer base depends on who those retailers are.
Using Tembi’s size scoring (0–100), we can see clear portfolio skews:

Category exposure shows the same idea from a different angle: providers aren’t just “generalists” - each ends up with a distinct category footprint (e.g., stronger concentration in health & medicine, fashion, electronics, etc.)
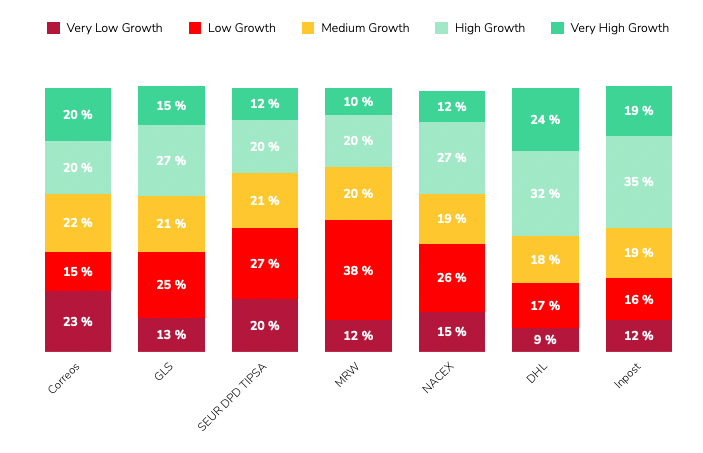
Finally, our Growth Indicator model adds a forward-looking layer: DHL and InPost have the strongest growth-weighted portfolios, with 56% and 54% of their clients forecast to be in high or very high growth bands. Correos shows a more balanced mix across growth bands.
If you want the practical “so what” for Spain, three things stand out:
Spain’s last-mile market is large, competitive, and still structurally under-optimised in checkout. Correos dominates branded presence and first-position frequency, white-label checkouts hide a big part of the market, and OOH remains a clear runway - with meaningful differences in portfolio quality and growth potential across providers.
Download the full Spain report, or schedule a Tembi demo to see your competitive landscape updated continuously across markets - including comparisons to our Italy analysis
Italy counts 94,724 online retailers, with clothing, groceries and beauty leading the mix, average home delivery cost at €6.5 and OOH at €5.8. With continued investment and InPost’s strong market entry, OOH delivery is expanding rapidly and reshaping the competitive landscape. This Italian last-mile delivery market analysis maps the structure, methods and provider portfolios behind the numbers.
Working in last-mile delivery and interested in another competitive market analysis beyond Italy? Let's connect. Download the full report here.
Italy remains one of Europe’s most active e-commerce markets by merchant count and parcel flow. To help last-mile executives benchmark strategy, this report profiles the market composition, delivery method availability and pricing, and the competitive landscape across six core providers: GLS, Poste Italiane, DPD BRT, DHL, InPost, and FedEx (TNT). You’ll see where demand concentrates by category, how pricing positions each method, and how provider client portfolios skew by retailer size and expected growth.
All figures are derived from Tembi’s continuous monitoring and analysis of Italian online retailers and checkout setups, with consistent taxonomy and normalisation to support like-for-like comparisons. Use it to maintain competitive advantage, capture share in attractive segments, and understand market dynamics with clarity.
Quick takeaways
Italy’s 94,724-strong retailer base skews to clothes & shoes (≈12.1%), then food & groceries (≈6.7%), and beauty (≈5.4%). The size pyramid shows most merchants are medium, fewer large, and about 1% very large, indicating a wide long-tail with concentrated head accounts that influence parcel mix and service expectations. The latest available data from 2020 suggest that around 830 million parcels are shipped domestically each year. Given the latest e-commerce growth estimation of an average annual growth rate of 4.5%, parcel volumes could now be approaching one billion shipments.
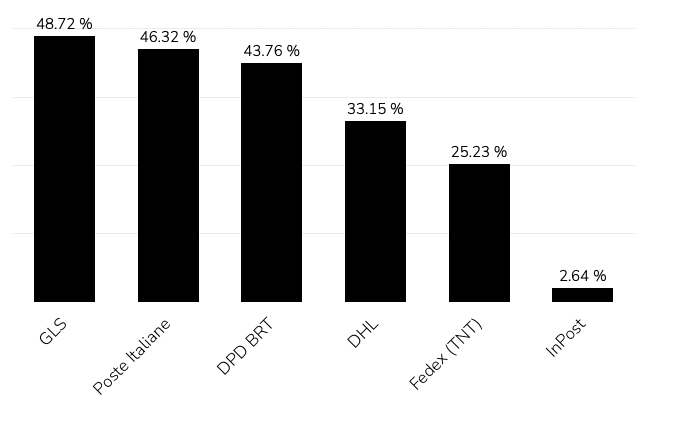
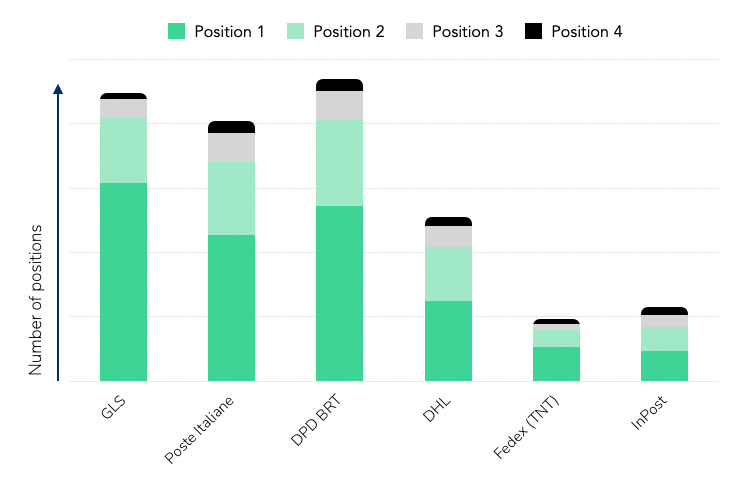
GLS and Poste Italiane hold the broadest presence across Italian webshops - GLS appears in 48.7% of retailer checkouts and Poste Italiane in 46.3%. DPD BRT, DHL, InPost, and FedEx (TNT) follow, forming the rest of the competitive landscape.
When looking at the first delivery option offered to shoppers, GLS leads with roughly 30%, followed by DPD BRT (26%) and Poste Italiane (22%).This ordering pattern reflects how retailers prioritise providers based on network reach, reliability, and negotiated terms rather than pure visibility.

In short:
Across Italian retailers, home delivery remains dominant, offered by roughly 89% of webshops. Parcel shops (≈9%) and parcel lockers (≈3%) are still at an early stage of rollout, but both formats are expanding as networks and integrations mature.
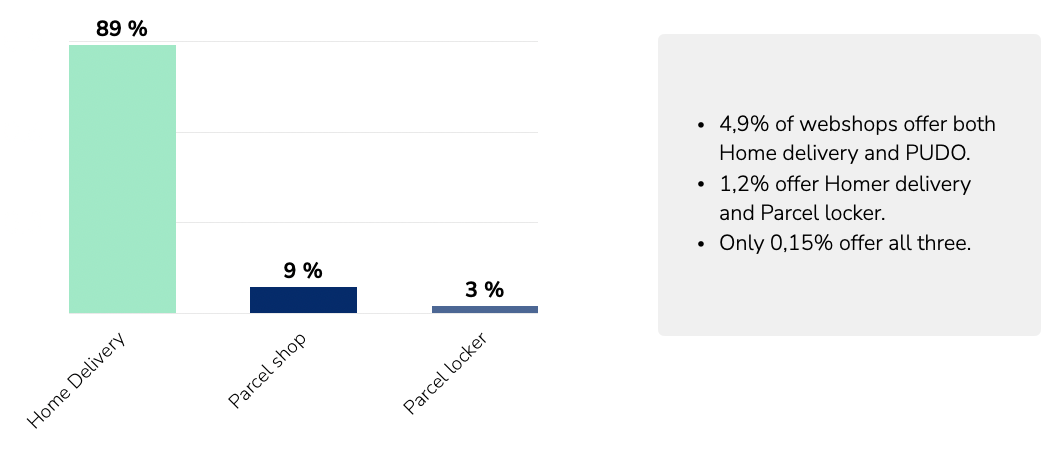

The limited share of OOH options reflects the market’s current infrastructure capacity rather than consumer demand alone. With continued investment from providers such as InPost, Poste Italiane, and DPD BRT, OOH coverage is expected to increase steadily over the next few years, giving retailers broader flexibility in how they structure delivery choices and costs.
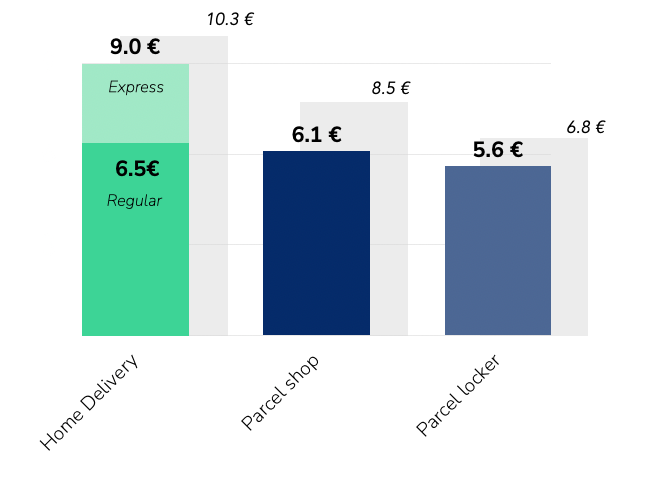
Pricing across delivery methods follows a clear hierarchy. Home delivery is the most expensive, with DHL and FedEx (TNT) positioned at the higher end in line with their express and international focus.GLS, Poste Italiane, and DPD BRT sit around the market average, reflecting large-scale domestic coverage and standardised pricing structures. InPost maintains the lowest price levels across OOH deliveries, consistent with its parcel-locker model and high network density.
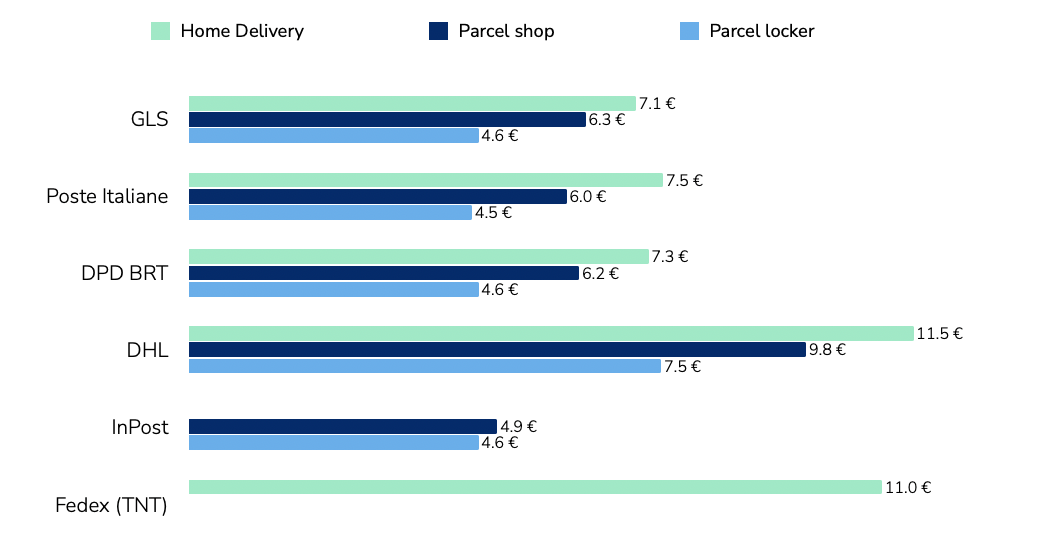
The pricing gap between home and OOH - €6.5 vs €5.8 on average - highlights the economic rationale for providers to keep expanding out-of-home capacity, and in line with most other markets. As networks grow denser, these price differences will continue to influence retailer delivery mix.
Tembi’s analysis segments retailer clients by size and growth outlook, showing how each provider’s portfolio is positioned across the Italian market.
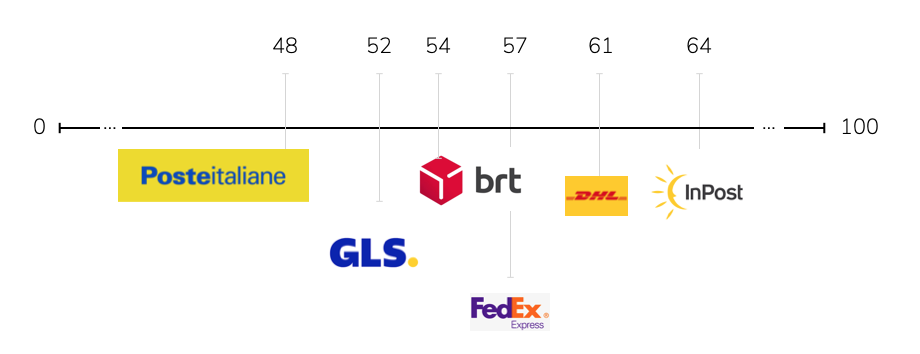
This chart summarises the average retailer size of each provider’s client base on Tembi’s 0–100 scale, where higher scores represent larger and more established webshops.

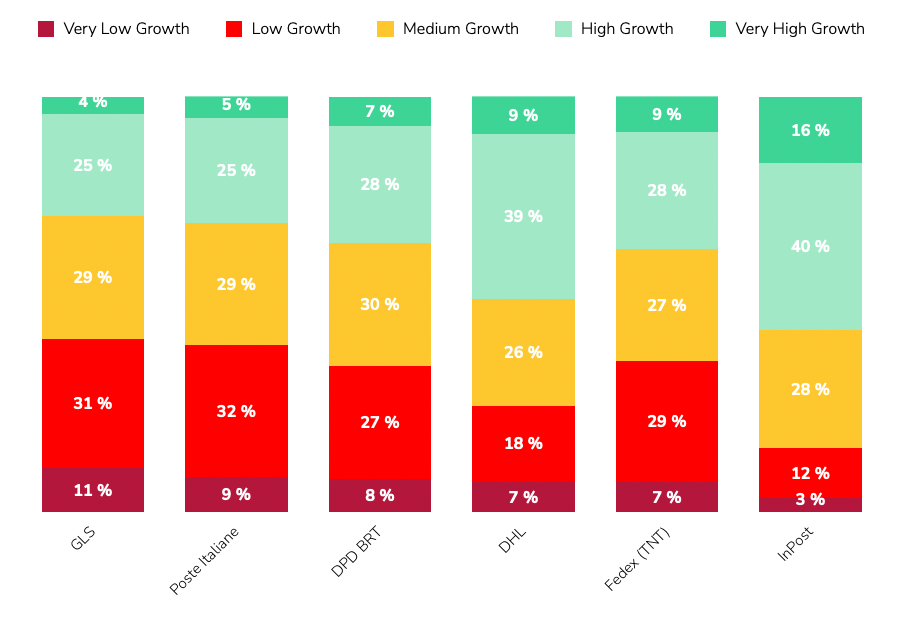
The stacked bars show how each delivery provider’s clients are distributed by retailer size:
Using Tembi’s forward-looking Growth Indicator - a composite of product portfolio development, traffic momentum, financial proxies, and export activity - InPost has the highest share of high- and very-high-growth retailers, reflecting its alignment with fast-scaling digital merchants. DHL also skews towards higher-growth segments, supported by its express and cross-border strengths. Meanwhile, GLS, Poste Italiane, and DPD BRT hold proportionally larger bases of mature retailers, providing stability and recurring parcel volume.
Locker and parcel shop networks are entering a phase of rapid expansion across Italy.InPost leads with more than 3,000 lockers installed at the start of 2025. DHL and Poste Italiane jointly reported around 500 lockers by mid-2025, alongside an ambitious plan to reach 10,000 units in the coming years. DPD BRT, through its Fermopoint network, aims for up to 4,000 lockers within five years, while GLS initiated its own rollout during 2025.
This coordinated investment places Italy on a clear multi-year OOH growth trajectory, reshaping how carriers balance cost, capacity, and customer reach. The build-out is not just a convenience upgrade; it’s a structural shift in network economics - each new locker or parcel shop reduces last-mile cost per parcel and expands delivery capacity in urban areas.
Why it matters
Rising locker and parcel shop density directly influences:
As the network matures, OOH will become a central component of Italy’s last-mile infrastructure, shaping both consumer choice and carrier efficiency.
Tembi’s analysis highlights three practical dimensions that matter for market strategy and portfolio alignment.
1. Segment by retailer size and category
Italy’s retailer landscape is dominated by small and medium merchants, but larger and premium-category retailers - such as fashion, beauty, and consumer electronics - set higher expectations for service speed, reliability, and returns. Delivery providers should align SLAs, OOH coverage, and returns management to match those standards while maintaining efficient access to the long tail.
2. Model the price–mix effect
With home delivery averaging €6.5 and OOH €5.8, even a modest shift in checkout mix can materially improve cost-to-serve for both carriers and retailers. Tracking these dynamics by category and region helps identify where OOH incentives or dynamic checkout sequencing can achieve measurable margin impact.
3. Track portfolio momentum
Provider client portfolios differ in growth exposure. InPost and DHL are more concentrated among high-growth retailers, while GLS, Poste Italiane, and DPD BRT anchor the market’s stable core. Monitoring these shifts over time helps providers balance predictable SMB volume with faster-growing digital retailers, ensuring coverage across both maturity extremes.
Italy’s last-mile market is broad, price-competitive, and evolving. Method economics continue to favour OOH expansion as networks densify; provider portfolios show divergent exposures across retailer size and growth; and the locker build-out marks a long-term structural transformation rather than a short-term initiative.
This Italian last-mile delivery market analysis outlines the market map and comparative signals needed to inform planning, benchmarking, and partnership strategies across the sector.
Download the full Italian market report or schedule a Tembi demo to see your competitive view updated continuously.
Delivery fees across the Nordics have followed clear seasonal patterns and strategic adjustments over the past two years. Drawing on data from over100,000 webshops in Sweden, Denmark, Finland, and Norway between Q1 2024 and Q32025, we track how average consumer delivery prices (in EUR) have shifted.
This analysis zooms in on the Q4 holiday peak, highlights country-specific behaviours, and compares delivery methods in urban areas - parcel lockers, pickup points, and home delivery. The aim is to show how webshops shape their pricing strategies and how these evolve through the year.

Seasonality is a defining feature of delivery pricing in the Nordics. Q4, the peak holiday quarter, typically brings stable or higher fees rather than discounts. In late 2024, Black Friday and Christmas did not lead to cheaper delivery - instead, many webshops kept prices firm or lifted them slightly.
· Sweden: average home delivery rose from €7.60 in Q3 2024 to €8.00 in Q4, the annual peak.
· Denmark: small increases, such as parcel shop delivery at €5.89 in Q4 versus €5.83 inQ3.
· Finland: parcel shop fees jumped by around 5% in Q4 2024.
· Norway: parcel box delivery peaked during the holiday quarter.
The pattern suggests that in high-demand Q4, retailers prioritise covering fulfilment costs over cutting fees - even when running heavy sales campaigns.
This shifts in Q1, when prices correct downward. After the holiday rush, many webshops reduced or normalised fees:
This Q1 softness reflects the post-holiday slowdown in demand and renewed competition to attract consumers during a quieter season.
Q4 2024 stands out as a high point for delivery fees in several markets, corroborating that peak season surcharges and fewer free-shipping promos were in effect. In fact, during Black Week (Black Friday 2024), retailers across Noridcs reduced the prevalence of free shipping by 4% compared to 2023, opting instead to set spend thresholds or promote premium paid options (source: ingrid.com). In other words, fewer orders enjoyed “free delivery” in Q4 2024, as merchants nudged customers toward paid faster delivery or order bundling.This strategic move helped protect margins during the holiday boom – and consumers generally went along, paying for delivery when the value (speed, convenience) was clear (source: ingrid.com). The seasonal insight here is that peak demand doesn’t equal cheaper shipping; if anything, many webshops use the period to upsell premium delivery or maintain prices, rather than offer blanket free shipping.
Moving through 2025, the Q2 and Q3 2025 data show an interesting reset. By summer 2025, average delivery charges in many categories fell back to or below their levels from the previous holiday season. This sets the stage for how Q4 2025 might play out – which we’ll discuss in a moment.
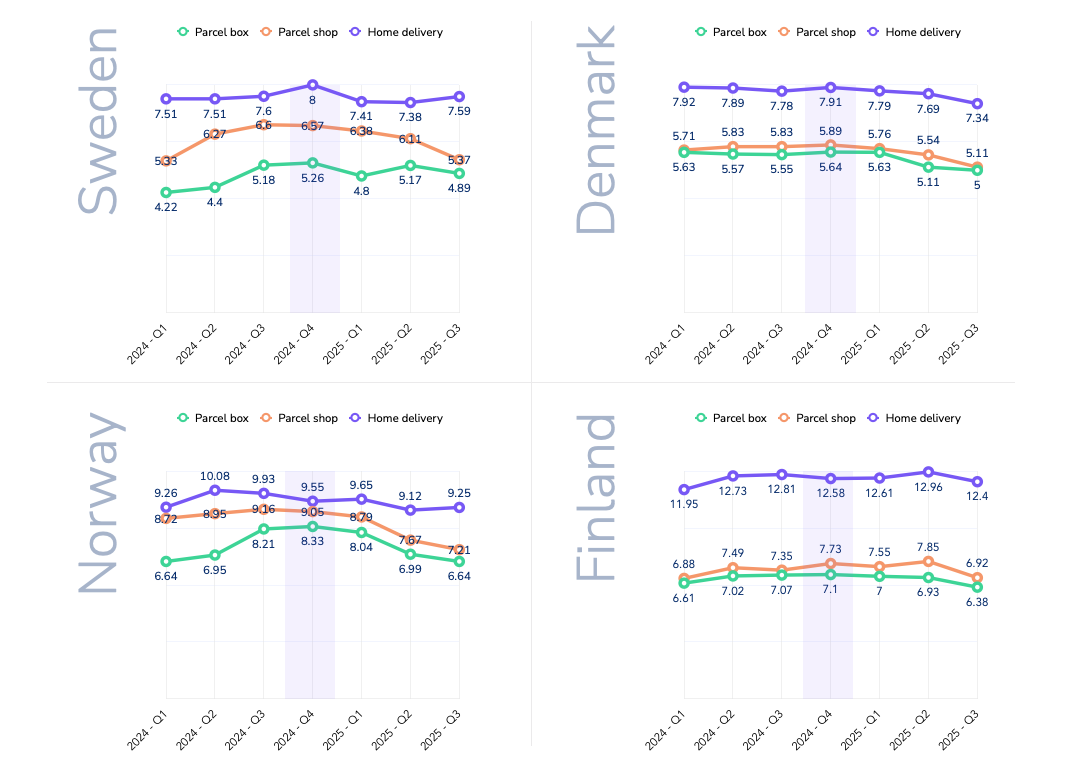
Each Nordic market shows distinct pricing dynamics, shaped by competition, consumer behaviour, and delivery costs.
Swedish webshops consistently post the lowest delivery fees in the region.In early 2024, prices were modest - around €4.20 for locker delivery and €7.50 for home delivery. These rose steadily through the year, with parcel box and parcel shop deliveries more than 20% higher by Q3/Q4. Home delivery peaked at €8.00 in Q42024, reflecting inflationary pressures and webshop/carriers passing higher rates on to consumers.
In 2025, the trend reversed. By Q3 2025, parcel shop delivery had dropped from €6.57 in Q4 2024 to €5.37 (an 18% decline),while home delivery eased back to €7.59. This points to intensifying competition, with Swedish retailers willing to cut delivery prices quickly to gain an edge.
Denmark’s delivery pricing remained stable through 2024, with parcel lockers and pickup points in the mid-€5 range and home delivery around €7.80–7.90. Even in Q4, increases were marginal- for example, parcel shop delivery at €5.89 in Q4 versus €5.83 in Q3.
The shift came in 2025. By Q3, parcel lockers averaged €5.00 and parcel shops €5.11 - 10–13% lower than the prior holiday season. Home delivery also dipped to €7.30 from €7.91 in Q4 2024. This gradual decline suggests Danish webshops began competing more actively on delivery price or carriers pressed the prices further down.
Finland remains the most expensive Nordic market for delivery - especially for home delivery. In 2024, Finnish shoppers paid €12–13 for home delivery, nearly double Sweden’s average. Out-of-home methods were also high at €7+. Prices climbed steadily through 2024, with parcel shops up 12% by Q4.
In 2025, home delivery crept even higher, peaking at €12.90 in Q2. But by Q3, parcel locker and shop fees had fallen sharply - down about 10% from Q2, back to early-2024 levels. Home delivery stabilised around€12.50.
Norway experienced the most pronounced swings. In 2024, home delivery peaked at €10.08 in Q2, while parcel lockers (€8.21) and parcel shops (€9.16) hit highs in Q3. Interestingly, Q4 home delivery was lower than earlier in the year at €9.55.
By 2025, Norwegian webshops had cut prices heavily, especially for out-of-home delivery. Parcel lockers fell from over €8in late 2024 to €6.64 by Q3 2025- a 20% year-on-year drop. Parcel shop delivery followed a similar pattern, down about €1.20 on average versus Q4 2024. Home delivery also eased slightly to €9.25 by Q3.
The widening price gap between home and pickup options suggests a deliberate push to shift volume to more cost-efficient methods. For carriers, Norway highlights how quickly competitive conditions can change - and the need to adjust pricing strategies in real time.
To summarize the country trends, Table 1 highlights how delivery fees in Q3 2025 compare to the last peak season (Q42024). Most markets saw notable declines in that period, especially for out-of-home deliveries:
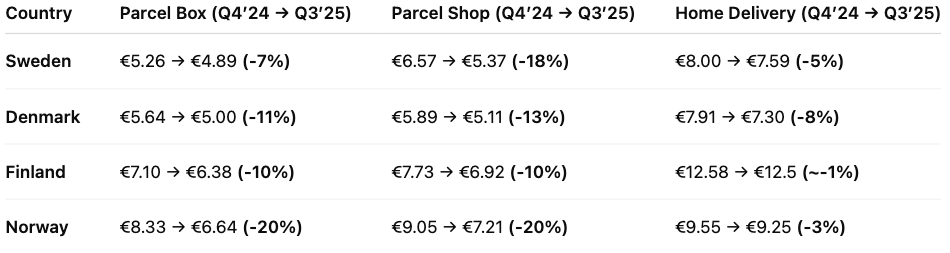
Data clearly shows that out-of-home delivery is significantly cheaper for consumers in urban areas – a natural effect when carriers can deliver 5–10 times more parcels per driver compared with home delivery.
Parcel box (locker) delivery
· Cheapest option across all markets by 2025(~€5–6.5).
· Prices spiked in 2024 (e.g. Norway €6.6 → €8.3)but dropped back sharply in 2025.
· Volatility suggests retailers test price sensitivity, then reset as competition kicks in.
Parcel shop(pickup point) delivery
· Typically a few cents above lockers, but fell notably in 2025.
· Norway: from ~€9 in 2024 to €7.2 by Q3 2025.
· Pricing gap with home delivery widened, creating strong incentives for consumers to choose pickup.
Home delivery
· Premium service, consistently the most expensive.
· Held steady through 2024–25: ~€7.5 in SE/DK,~€9.3 in NO, ~€12.5 in FI.
· Only small price drops, with Sweden (-13% YoY)the exception.
· Discounts remain rare and tied to high order values.
Out-of-home delivery became cheaper in 2025, while home delivery kept its premium. This reflects a conscious decision: steer demand towards lockers and pickup points to cut last-mile costs and ease peak-season pressure. Black Week 2024 showed the effect in practice - locker usage rose by four percentage points and delivery times improved as shoppers embraced flexible collection (source: ingrid.com).
For logistics providers and retailers, aggressive pricing on out-of-home delivery seems to become a core lever: it nudges cost-conscious consumers, reduces operational strain, while keeping satisfaction high. But the gap has limits - home delivery still anchors convenience expectations and remains a profit lever. The real challenge is balance: keeping lockers and pickups highly attractive without eroding the value or accessibility of home delivery.
Collaboration between retailers and logistics providers is key here, ensuring service levels meet expectations as more customers choose out-of-home - seen clearly during Black Week, when lockers not only gained share but also delivered faster on average (source: ingrid.com).
To keep the forecast transparent, we applied a simple model: for each country × delivery method, we took the Q4-over-Q3 seasonal change from 2024 and applied that ratio to Q3 2025 levels. Where 2025 trended lower than 2024, we also include a conservative midpoint between Q3 2025 and that baseline.
· Parcel box(lockers): €5.6–6.0
· Parcel shop(pickup): €6.1–6.3
· Home delivery: €9.0–9.2
Seasonal lift from Q3 to Q4 looks modest. Home delivery remains the premium option, while lockers and parcel shops stay clearly cheaper.
· Sweden: home ~€8.0 (flat vs last year); parcel shop ~€5.3 and lockers ~€5.0 (well below last year).
· Denmark: home ~€7.4; parcel shop ~€5.2; lockers ~€5.1 (all lower than last year).
· Finland: home ~€12.5 (still high); parcel shop ~€7.3; lockers ~€6.4 (both down year-on-year).
· Norway: home ~€9.25 (slightly below last year); parcel shop ~€7.1; lockers ~€6.7 (~20%down year-on-year).
Nordic delivery prices have eased through 2025 after peaking in late 2024, especially for out-of-home options (parcel box and parcel shop). Applying last year’s Q4-over-Q3 seasonality to current Q3 levels points to only small Q4 uplifts: lockers and pickups remain the low-cost choices, while home delivery stays premium and broadly flat.
Country patterns matter. Sweden and Denmark have lower 2025 bases and limited room for Q4 increases. Finland remains structurally high - especially on home delivery - so stability is more likely than hikes. Norway has corrected sharply this year, with retailers continuing to nudge volume toward cheaper lockers and pickups.
The underlying pricing strategies are clear:
· Continued shift to out-of-home delivery. Lower pricing here is deliberate - directing volume away from costly home delivery and easing last-mile strain.
· Home delivery as a premium anchor. Price cuts are modest; competition is about service quality (slots, ETAs, first-attempt success) rather than cents.
· Seasonal resets. After Christmas, prices ease in Q1—a cycle webshops use to stay competitive in slower months.
Finally, weigh this outlook against external factors that can quickly shift the picture: capacity constraints and consumer sentiment. If sentiment weakens, retailers may lean harder on thresholds and targeted incentives.
Cross-border online sales are an important growth channel for webshops in Europe’s integrated market. This article examines why certain international sales corridors dominate for e-commerce merchants in five European countries – the Netherlands, Germany, Denmark, Italy, and Sweden. We analyse the top export markets of webshops in each country (based on provided top-10 destination data) and explore the factors behind these patterns, including geography, language, economic ties, consumer behaviour, and logistics integration. We also benchmark the maturity of each country’s e-commerce sector (webshop density and online-selling share).The goal is to provide European e-commerce professionals with insight into existing cross-border flows and how to leverage them.
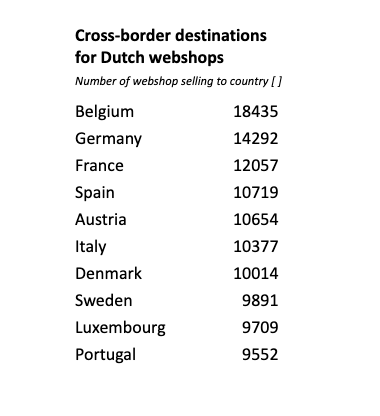
Dutch webshops are remarkably outward-looking, with nearby Belgium and Germany as the top destinations for online exports. Belgium tops the list (a large portion of Dutch cross-border orders), thanks in part to shared language (Dutch is spoken in Flanders) and immediate proximity facilitating quick shipping. Likewise, Germany – Europe’s largest e-commerce market – is a close neighbor and a natural target for Dutch retailers. Geographic centrality and excellent logistics infrastructure in the Netherlands (Rotterdam port, Schiphol airport) make it a hub for distributing goods across Western Europe, so Dutch webshops easily serve France, Spain, and Italy as well (ecommercegermany.com). Many Dutch merchants localise in English or multiple languages, leveraging the population’s high foreign language proficiency. These factors, combined with the Netherlands’ high Internet penetration and consumer spending, explain why Dutch online sellers extend their reach broadly into Europe. The cross-border focus is diverse, but the Benelux and adjacent EU markets dominate Dutch e-commerce exports.

German webshops tend to have a more regional cross-border focus, reflecting Germany’s huge domestic market which somewhat lessens reliance on exports. Nevertheless, German retailers mainly ship to German-speaking neighbours, especially Austria (the top export market) and Switzerland, as well as the Benelux countries (ecdb.com). Austria’s shared German language and culture make it a natural extension of the domestic market, and indeed over half of Austria’s cross-border e-shopping is from Germany (ecdb.com), illustrating this tight linkage. Similarly, a high share of Luxembourg’s online imports come from German sites (ecdb.com), aligning with Germany listing Luxembourg among its top export destinations. Beyond these, German e-sellers target large EU economies like France, Italy and Spain, but volumes there are lower relative to Germany’s size. Geographic proximity and EU single-market ties play a key role – Germany’s neighbours (Austria, Netherlands, France, Poland, Denmark, etc.) comprise most of its top 10 export markets. While Germany has the most e-commerce sales in Europe, its cross-border activity (in percentage terms) is more modest than smaller countries’, as its home market is very self-sufficient. Still, German webshops capitalise on being in the center of Europe by serving nearby countries with minimal barriers.
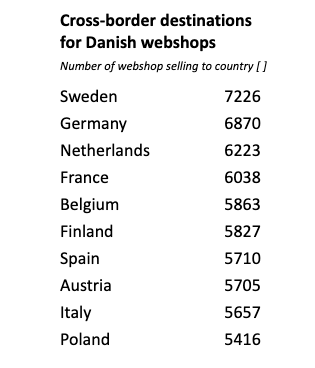
Denmark’s online retailers are highly oriented toward Nordic and nearby EU markets. The top export destination is Sweden, Denmark’s neighbour across the Øresund bridge, reflecting strong regional integration. Danish merchants benefit from cultural and linguistic affinities within Scandinavia (Danish and Swedish are mutually intelligible to a degree), and importantly from a merged postal network (PostNord) that eases Denmark–Sweden deliveries. Germany is the second-most common destination for Danish webshops – a logical outcome of geographic adjacency and Germany’s market size. Other top targets include the Netherlands, France, and Belgium, indicating Danish online retailers don’t confine themselves to Scandinavia. High English proficiency in Denmark and use of international e-commerce platforms enable even small Danish webshops to sell into distant European markets. Finland and Norway also appear in Danish sellers’ top corridors, consistent with a Nordic e-commerce cluster. In sum, proximity and regional ties drive much of Denmark’s cross-border trade, but Danish companies’ agility and the necessity to grow beyond a small domestic market push them to court major economies across Europe as well.

Swedish webshops likewise show a strong Nordic focus coupled with EU-wide reach. Denmark and Finland rank among the top export markets for Sweden’s online retailers, owing to Sweden’s position bridging Nordic neighbours (and sharing a land border with Finland). Cross-border commerce within the Nordics is bolstered by relatively aligned consumer habits and the prevalence of English, though language differences (Swedish vs. Finnish) still pose some barrier. Sweden’s list of top e-commerce export destinations also features Germany, the Netherlands, France, Spain, and Belgium, mirroring a broad Western European outreach similar to Denmark’s. Sweden’s e-merchants benefit from being in one of Europe’s most digitally mature societies, and they leverage efficient logistics links (for example, ferry routes and international carriers) to serve far-flung customers. Still, the easiest wins are nearby: Denmark alone accounts for a significant share of Swedish cross-border online sales, exemplifying how regional integration (e.g. PostNord’s bi-national network) underpins cross-border e-commerce in Scandinavia.

Italian webshops, operating in a large but traditionally less digitized market, concentrate their cross-border sales on Europe’s biggest economies and nearby countries. Germany is the number-one export destination for Italian online sellers by volume, followed closely by France and Spain, which together account for a large majority of Italy’s e-commerce exports (amavat.eu). This reflects both geographic proximity (France and Austria border Italy, and Germany is just beyond the Alps) and strong demand for Italian products (e.g. fashion, design, food) in wealthier EU markets. Austria is another key corridor (benefiting from adjacency and a shared German-language business environment), and neighbors Switzerland and Slovenia (not in the top-ten list provided, but likely significant) also draw Italian exports. Interestingly, Northern European markets like the Netherlands, Belgium, Denmark, Sweden and Poland appear among Italy’s top export destinations as well – indicating that Italian brands have appeal across Europe despite distance. Italy’s cross-border e-commerce has been surging in recent years, growing its share of total online turnover from ~29% to 39% between 2019 and 2022 (amavat.eu). However, Italian webshops are relatively fewer per capita, so much of this cross-border activity is driven by a subset of competitive firms (often via marketplaces). In summary, Italy’s e-commerce exports gravitate toward large EU consumer markets and nearby neighbors, leveraging Italy’s renowned products, even as the domestic e-commerce sector catches up in maturity.
Despite national nuances, these five countries share some common patterns. Neighboring countries dominate cross-border e-commerce flows in many cases – a classic gravity effect where shorter distances, lower shipping costs, and familiar cultures facilitate trade. For example, the Netherlands-Belgium, Germany-Austria, and Denmark-Sweden corridors are all top-ranked, underscoring the importance of geographic proximity and shared language or cultural ties. This aligns with research finding that even online, distance and cultural/language factors still significantly impact trade (though less than offline) (econstor.eu). Additionally, all five nations see major EU economies (Germany, France, Spain) in their export mix. These large markets are attractive targets due to their sheer number of online shoppers – Germany and France are among Europe’s top destinations for cross-border e-commerce imports (ecommercegermany.com). In fact, German consumers are so pivotal that every country’s webshops list Germany as a top-3 foreign market (except Germany itself), and German shoppers account for a sizeable share of many neighbour's’ online sales (ecdb.com).
However, there are clear differences in scope. The smaller, digitally advanced countries (Netherlands, Denmark, Sweden) tend to export to a broader array of markets across Europe, reflecting their need to go global to scale beyond limited domestic populations. Their top-10 lists include more distant EU distinations – enabled by strong English usage and pan-European platforms. In contrast, Germany and Italy (the larger markets) show a relatively more regional focus, concentrating on immediate neighbors and a few key economies. German webshops’ cross-border sales are more regionalized (e.g. mostly EU neighbors), and Italy’s exports tilt heavily to Western Europe (with limited Nordic focus). Another difference is the reciprocity of corridors: e.g. Denmark and Sweden mutually rank each other very high, whereas Italy and Germany have an asymmetry (Italy relies on Germany more than Germany on Italy). This hints at differing product specializations and consumer preferences driving flows one way more than the other. Finally, language plays a part – shared language pairs (Dutch-Flemish, German-Austrian, Scandinavian languages) clearly boost mutual e-commerce, whereas language barriers can limit cross-border reach unless sellers localise (which not all Italian or German SMEs do as readily as Nordics). Overall, all five countries leverage the borderless EU market, but the extent of their reach and the partners they prioritize vary with their size, culture, and e-commerce sophistication.
The strength of a country’s e-commerce sector underpins its cross-border capabilities. Two useful indicators are the number of webshops per capita and the share of companies engaging in online sales. Below is a brief benchmark of the five countries:
Even as shipments cross borders, the “last mile” must cater to local preferences. Logistics firms should note that a Danish package destined for Sweden or a Dutch package to France will require localised last-mile handling – from language-specific notifications to preferred delivery methods (locker pickup, home delivery culture, etc.). Adapting delivery options to the recipient country’s norms increases success. For instance, offering Pakketboxen or parcel lockers in the Netherlands/Belgium, home delivery with SMS coordination in Germany, or convenient pickup points in Sweden/Denmark can improve customer experience. Cross-border delivery success is not just about moving goods across distance, but also navigating the “last kilometre” in a foreign context. Providers may need to coordinate returns handling across borders as well, given high return rates in e-commerce – setting up return logistics in the top destination countries can be a competitive advantage for carriers serving exporters.
In conclusion, understanding these dominant cross-border sales channels allows logistics and last-mile providers to align their networks with e-commerce trade flows. By focusing resources on key routes, integrating services regionally, and tailoring last-mile delivery to each market’s needs, providers can improve efficiency and customer satisfaction. The European e-commerce landscape is increasingly interconnected – especially within regional clusters – and logistics firms that adapt to these patterns will be well-positioned to serve both the booming cross-border volumes and the merchants driving them. Ultimately, the continued growth of cross-border e-commerce (nearly €171 billion in Europe in 2021, or ~25.5% of online revenue (ecommercenews.eu)) relies on frictionless logistics. Providers who innovate on these busy corridors will not only reduce costs but also strengthen the entire e-commerce ecosystem across Europe’s borders.
n commercial real estate, having the right insights can lead to valuable opportunities. Tembi's new report, "Netherlands Relocation Data & Predictions 2025," offers practical understanding and insights into upcoming shifts in the commercial real estate space.
Tembi’s AI-driven analytics blend market dynamics, employment patterns, and historical data to deliver accurate and reliable market forecasts.
Our analysis highlights 9,993 companies in the Netherlands likely to relocate during 2025, potentially affecting over 222,000 employees. Another 21,532 companies might also move offices within the next year, impacting nearly 700,000 employees.
Showing a clear understanding of local trends can enhance your credibility with clients. Our report details areas gaining or losing businesses, like Utrecht, Amsterdam-Duivendrecht, and Rotterdam. This information can help you deliver pitches that clearly match your clients' strategic interests.
Download the report today to stay informed about relocation trends, helping you anticipate market changes, uncover new opportunities, and stay ahead in your field.
Get the full report: Netherlands Relocation Data & Predictions 2025
Are you interested in getting more data and see how Tembi can you help you grow, talk to our sales team.
s we approach the year's final quarter, the stakes for last-mile delivery companies couldn't be higher. With the majority of revenue generated from B2C webshops, Black Friday, Cyber Monday, and the Christmas season represent crucial opportunities to maximise profits.
However, preparation for these peak periods involves more than ramping up staff, fine-tuning routing, and increasing throughput.
At Tembi, having helped over 40 last-mile providers across Europe, we understand that strategic planning on the commercial side can make or break your Q4 performance. To help you in the process we have collected a five of our key learnings on the topic.
Instead of focusing solely on acquiring new clients, ensure you're optimally positioned with your existing ones. Monitoring your position in their checkout process can yield significant returns. Being positioned as the top delivery provider at the delivery checkout can dramatically increase the number of orders you receive, often doubling or even tripling them.
From several of our Last-mile delivery clients, we have witnessed an average of 30%-50% increase in top-1 rankings working tactically with this. Typically, this amounts to a total increase of 20%- 33% in revenue from the existing client base!

Strategic client acquisition is essential. Focus on attracting webshops that boast a strong infrastructure, high order volumes, and the right geographical locations that align with your logistics.
These targeted efforts can significantly enhance your profit margins and operational efficiency.
On the other hand, failing to identify the clients that are right for you means losing time and money on unsuccessful outreach, attending irrelevant meetings, and seeing your closing rate decline. And even worse, potentially attracting a non-profitable client for your business.
Market research or a good market insight & sales intelligence tool will help ensuring you target the right clients. More is not always better.

Understand where you stand out compared to your competitors and highlight your unique selling points to differentiate yourself in a crowded market. Are your delivery times faster? Do you offer more sustainable options? Is your service reliability superior?
Tembi’s E-commerce Market Intelligence solution provides users with a comprehensive, data-driven market overview. This enables last-mile delivery companies to understand their performance and how they measure up against competitors. Our data not only visualises your strengths but also serves as credible evidence of your advantages.
Combining this data with comprehensive insights into each webshop in your market provides a significant advantage in sales meetings. You can tailor your pitch using up-to-date information, demonstrating how your solution will enhance the delivery experience for your customers' clients. This personalised approach showcases the specific benefits and improvements your service offers, making a compelling case for why your company is the best choice.

Q4 is a vulnerable time for webshops, where faulty shipments and slow deliveries can be extremely costly. Success often stems from a partnership approach between webshops and last-mile providers.
Engage deeply with your clients to ensure they see you as a trusted partner they can rely on during these critical periods.
In essence, this is where you want your sales and account management team to spend the majority of their time, which can be enabled by strong processes and the right tools/technologies to help your team be even more efficient.
Effective planning and execution require time, structured outreach, and meticulous account management. There is no easy way. The sooner you start, the better positioned you'll be to capitalise on the high season's opportunities. The time is now – not in October.
At Tembi, we bring years of experience in delivering market insights and partnership services that drive success.
Our market intelligence solutions provide last-mile delivery companies with continuously updated data and insights into webshops, delivery provider rankings, export markets, technology usage, product categories, and much more - allowing companies to react swiftly to changes, maintain top rankings, and increase revenue from their existing client base.
We tailor our supportive services to each client's needs, and we would love nothing more than to set up a free, non-committal session to discover how our e-commerce market intelligence solution could help your business achieve its revenue goals—both in Q4 and throughout the year.
ith Tembi you don’t just get enriched B2B company data, we’ve actually visited every webshop on the market to ensure it is operating, analysed its products to understand what product category it belongs to, and connected traffic data from SimilarWeb to understand how its popularity has developed.
A similar exercise would take 82 years for a person if s/he worked without a pause. And we do it bi-weekly.
At Tembi we are fascinated by the challenge of large-scale data gathering and analytics, and the more complicated, the more creative our product and data science team gets.Our Market Intelligence solution for companies targeting webshops - E-commerce Core – visits bi-weekly any active webshop in the European market capturing data on:
• Technology platform (WooCommerce, Shopify, Magento etc.)
• Payment providers/systems (Klarna, Ayden, Stripe etc.)
• Product data (Products sold, number of products, product growth etc.)
• Company data (Ownership, address, warehouse(s), financial data etc.)
• Operating markets (languages, export markets etc.)
On top of this, we use proprietary AI-models to categoriSe each webshop into a product category using both image recognition and large language models (LLM) to ensure high quality data when you filter our database.

We’ve been there ourselves, looking for that last filter to get a precise search result –why we’ve added over 50 filter options to our product to ensure you can find exactly the webshop you’re looking for. Filter or cross-filter on product categories, growth stage, number of employees, website traffic, number of products, languages –and if you would lack a filter, our team is quick to add it (if we have the data of course).
With deep data on each webshop, we can uncover insights by combining data in different ways. Our econometric and AI-models can today predict revenue estimations, company growth and for example technological investments – adding a deeper understanding of the maturity of a webshops operations.
Combining these insights with webshops data further increases your possibility of narrowing your targeting, as well as better understanding your current clients, or where you’ve had success lately.
With better data, we can get better insights that helps us reach our goals faster. If you’re interested in getting a demo or better understand how our clients use Tembi – don’t hesitate to book a call - or find more material about our E-commerce Core Solution here.

n today’s business world, being data-driven is no longer a question; it is a necessity. Organisations that don’t understand how to work with data and leverage it risk falling behind or even going out of business. However, merely being data-driven is not enough anymore. The rapid growth of access to artificial intelligence (AI) and lowered computing cost has amplified the significance of data, driving a shift towards predictive (and even prescriptive) intelligence to stay ahead of the competition.
Transitioning from a data-driven to an AI-driven organisation presents immense opportunities, enabling companies to understand the competitive landscape better, and leverage both market predictions to gain an edge, as well as improving operations to lower operating expenses. This transition requires a fundamental change in how we operate and organise the company. Secondly, we need to decide where to start, and whether to build, or buy a solution.
Here we share five, simple, steps to ensure your organisations success in this transition.
Achieving success with a transition is a strategic choice and an executional leadership challenge. It is crucial for management, whether top-level executives, business unit leaders, or team managers, to clearly communicate that the goal is to capitalise on the benefits of being data-, AI-, or analytics-driven, and where these benefits will have an impact, and why the transition is imperative for the organisation’s success. Leaders should:

Clarifying responsibility is essential as well as identifying the right person to lead the operational work of the transition. Allocate funding centrally rather than locally to prevent initiatives from being perceived as competing with short-term operational needs. By centralizing funding and clarifying responsibility, organisations can ensure that the transition to an AI-driven approach is viewed as a strategic investment rather than an operational cost.
It is unfortunate when initiatives become confined to a single department or individual. The benefits of an AI-driven approach are significant and extend across the entire organisation. Therefore, it is crucial to integrate solutions into as many teams as possible where there is a business case. Engaging more teams in the adoption phase offers several benefits:
Avoid placing the burden on a single individual. Employ the innovative power of the entire organisation to achieve greater success.
For new solutions and strategies to work, they must be integrated into daily operations. Overcoming existing habits and ways of working requires repetition until the new practices become habits. Incorporate the use of data and analytics tools into the organisational rhythm, such as in weekly meetings or daily stand-ups. Measure the impact of these new practices and share the progress with the entire organisation. Highlight how the transition is improving efficiency compared to previous methods.
Fostering an adaptive mindset is crucial for the transition to an AI-driven organisation. This mindset should infiltrate the company culture, regardless of role. Here are three tips for building a stronger adaptive mindset:
It might sound simple, but actively working on lifting and promoting the right people is very often overlooked. Make sure it is part of the leaderships action plan so this practice doesn’t fall between two chairs, or is forgotten within a couple of quarters.
Building a data and AI-driven organisation is essential for maintaining competitiveness in today’s business environment. Transitioning from being merely data-driven to embracing AI and predictive intelligence offers significant advantages, including a better understanding of the competitive landscape, leveraging market predictions, and improving operational efficiencies.
To ensure success in this transition, organisations should follow five key steps. First, management must clearly articulate that becoming an AI-driven organisation is a strategic goal. This involves transparent communication about the importance and challenges of the transition, along with regular follow-ups and continuous leadership support.
Second, organising the transition is crucial. This includes clarifying responsibilities and centralizing funding to ensure that AI initiatives are viewed as strategic investments rather than operational costs.
Third, disseminating the solution broadly across the organisation is vital. Integrating AI solutions into multiple teams enhances collaboration, shares costs, and accelerates the transition, leading to a higher overall ROI.
Fourth, embedding new solutions into daily routines ensures that these practices become ingrained in the organisation’s operations. Regular use and measurement of the impact help highlight the efficiency improvements over previous methods.
Finally, fostering an adaptive mentality is essential. This involves supporting superusers, hiring individuals with an innovative mindset, and promoting a culture that celebrates successes. An adaptive mentality ensures the organisation remains agile and responsive to new opportunities.
By following these steps, organisations can effectively leverage data and AI, achieving sustained success in an increasingly AI-driven world.
s the Swedish real estate market continues to evolve, new trends are emerging, particularly within the commercial sector. Our latest Market Intelligence Report offers an in-depth look into these shifts, providing deep insights and predictions for 2024that could help the industry better understand the market. And where to look for opportunities.
The past six months we have seen a significant activity within the Swedish commercial real estate scene. Over 3,005 companies, each with more than five employees, have relocated, showcasing a trend that follows previous years patterns. Notably, businesses ranging from 5 to 9 employees formed the majority of these moves, highlighting a high activity within this segment.
The Predictive pulse of 2024
Looking ahead, our analytical models have identified a high relocation indicator for 4,698 companies having more than five employees. This indication, drawn from AI models and extensive market data, suggests an active year with a lot of potential. Interestingly, the bulk of this movement is expected from companies with 10 to 49 employees, pointing to a important reshuffling in the commercial real estate space.
Regional Revelations
The report sheds light on the geographical nuances of these relocations. While the Stockholm region has traditionally been a hub of activity, the forthcoming year places a spotlight on Gothenburg, anticipating a higher volume of larger entities on the move. This regional redistribution of commercial real estate activity underscores the diverse opportunities unfolding across Sweden.
In light of that, we also see that companies and production units with more than 20employees in Stockholm tend to move more often than in other parts of the country. 33% of companies in Stockholm changed address during the last three years, while the same number in Gothenburg is 27%.
The Industries on the Move
Diving deeper, certain industries emerge as more mobile than others, including sectors like insurance, information services, and staffing solutions.
Why This Matters
For businesses and investors, understanding these patterns is crucial. The shifting sands of the commercial real estate market offer both challenges and opportunities. For investors, it's a chance to anticipate demand in growing areas and sectors. For businesses, the insights provide a roadmap for strategic decisions about where to plant their flags in a competitive landscape.
Access the full report by clicking on the picture below

he e-commerce sector in the Baltic region has seen consistent growth throughout the last ten years, opening up a number of opportunities for investment. Estonia and Latvia, in particular, stand out as some of the most rapidly expanding online retail markets within the Central and Eastern Europe (CEE) area.
Our first Market Intelligence report for the e-commerce Market in the Baltics looks into the foundation of the Industry and its suppliers
Find data & insights around:
🛍️ Number of Webshops in Estonia, Latvia and Lithuania.
📊 Webshop product category distribution per country
⚖️ Market specialisation
📦 Delivery providers, prices and methods
🖥️ Technology platforms that power the webshops
...and much more.
Access the full report for free by clicking on the image below!


