
.png)

Act before the market
European online payments are shaped by a mix of global platforms and strong local preferences. Below we break down the key payment providers across eight countries – Belgium, Switzerland, Denmark, Finland, Italy, Norway, and Sweden – highlighting who’s active in each market, how they fare in B2B vs B2C, and domestic vs cross-border trends. We also discuss how platform-native solutions (like Shopify Payments and PayPal integrations) enable cross-market reach.
The analysis is based on 208.035 webshops monitored by Tembi with data from the 21st of May 2025.
Belgium - 18.237 active webshops
Switzerland - 30.007
Denmark - 32.370
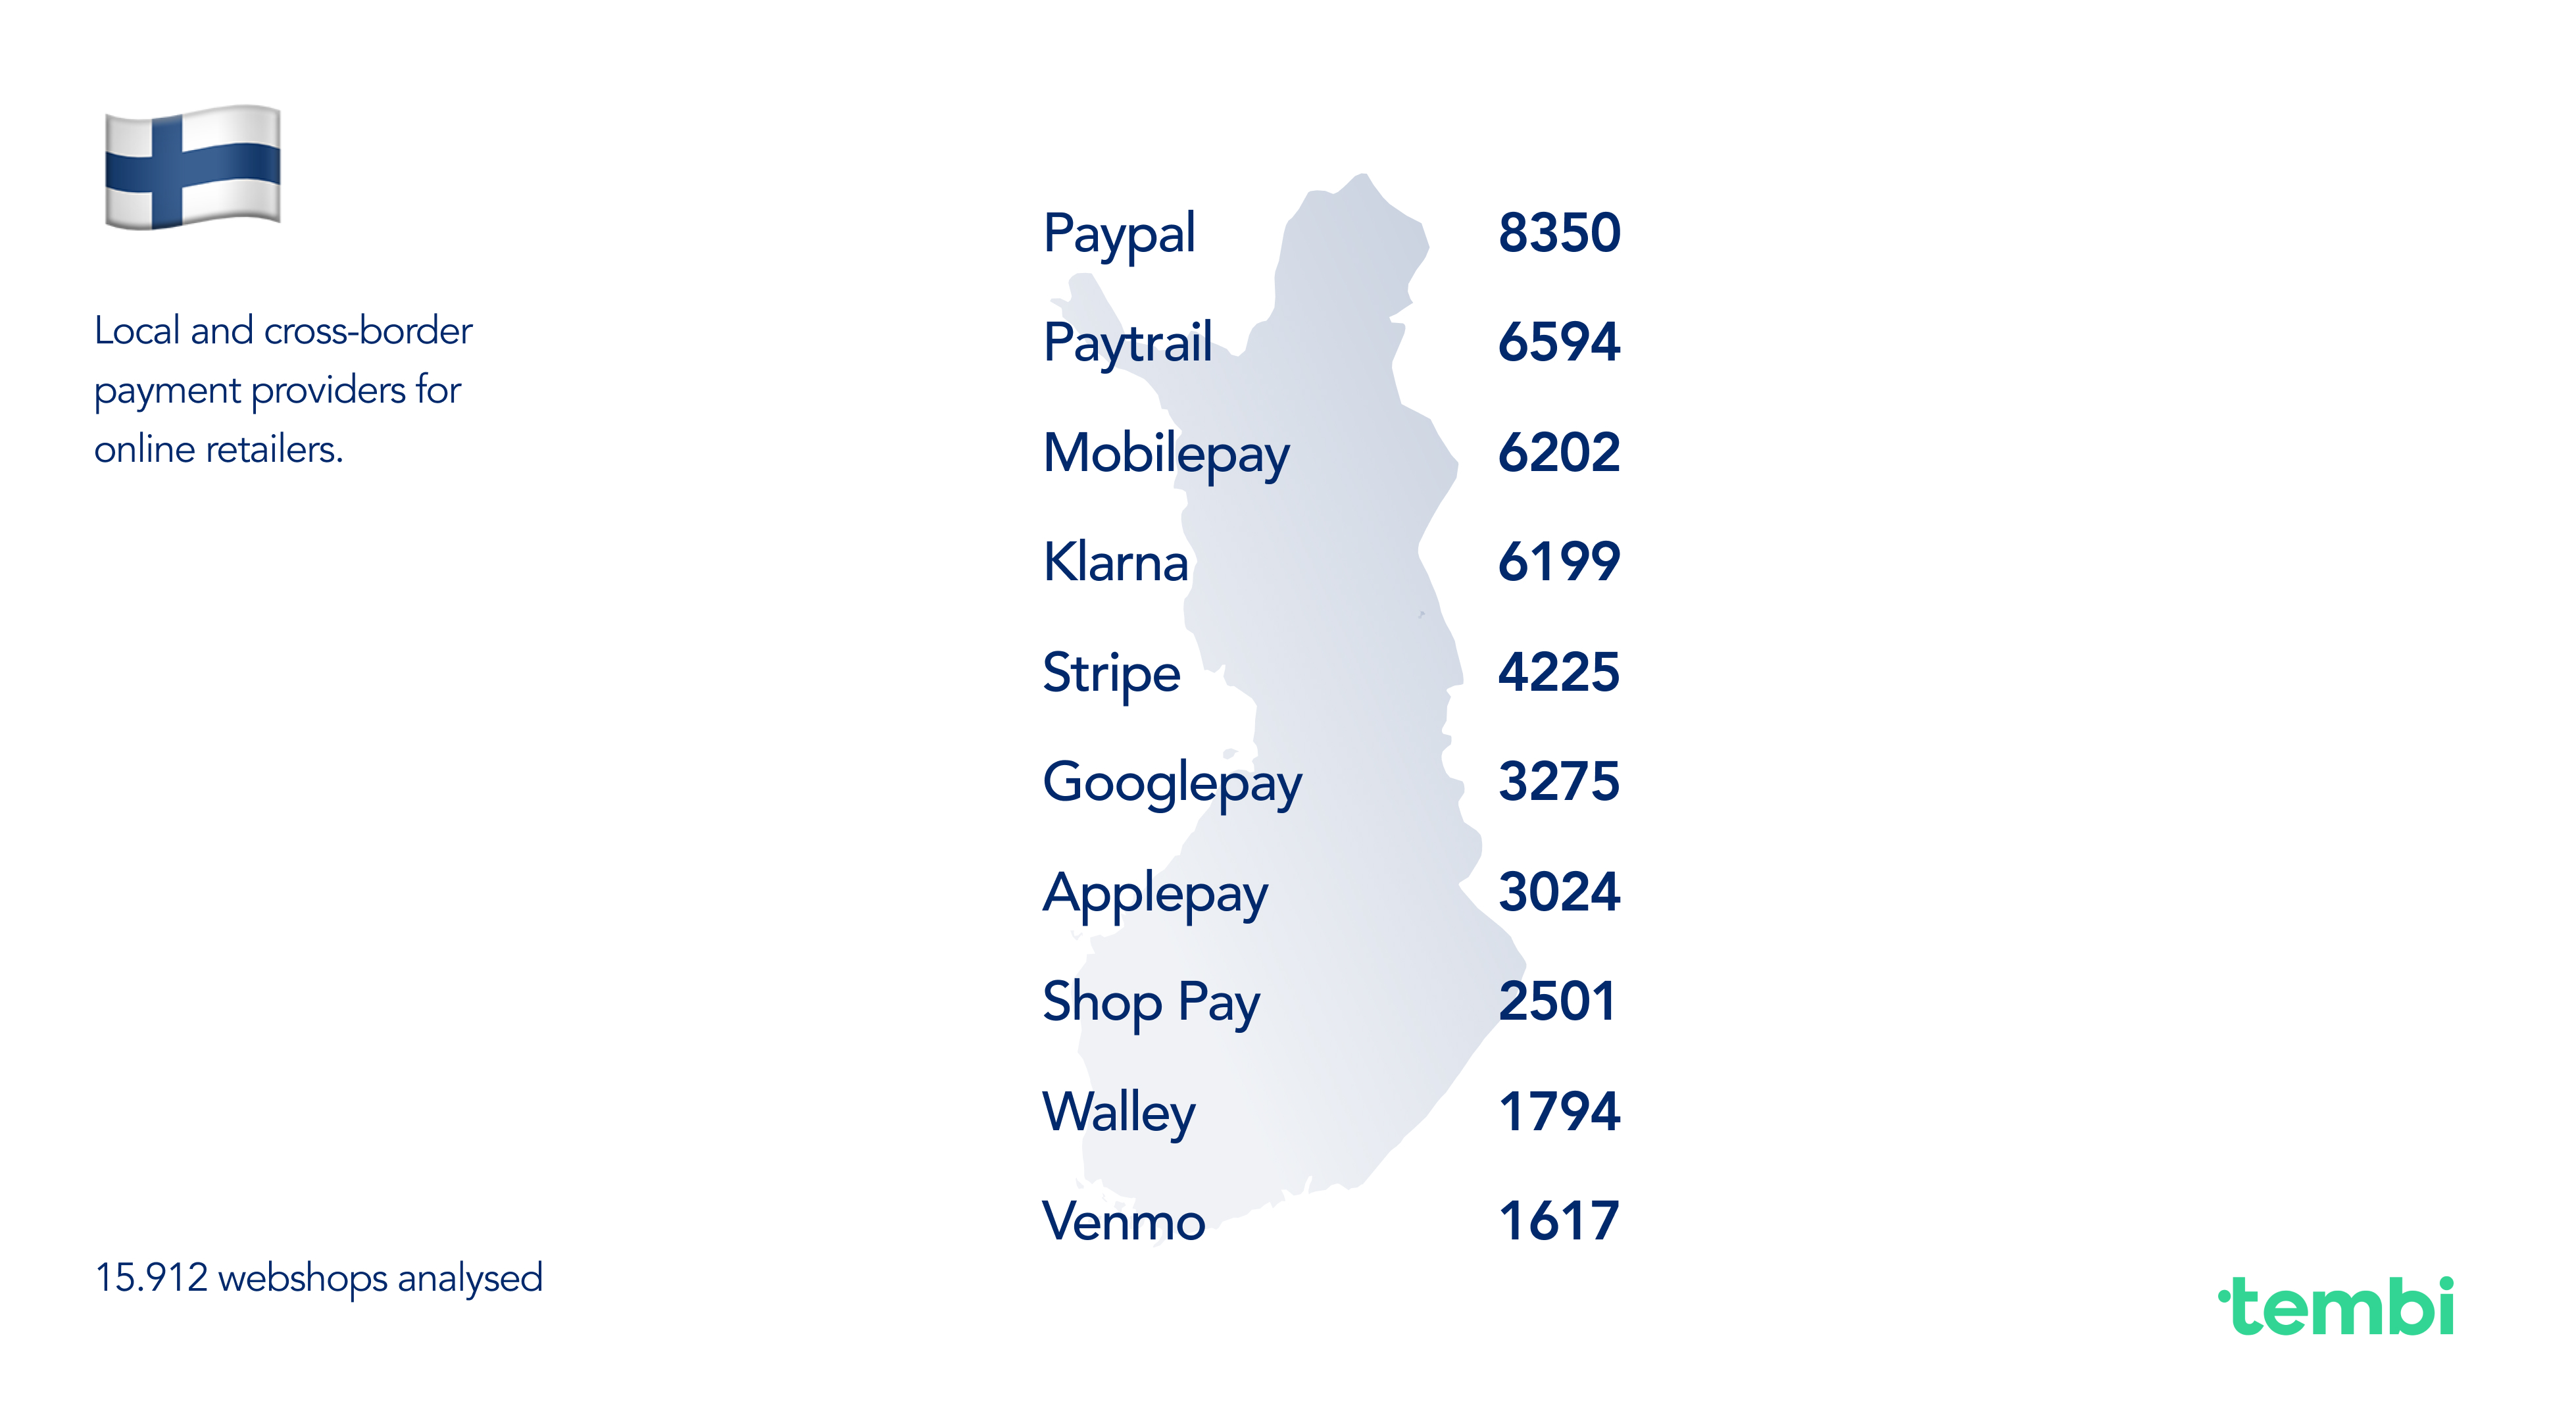
Finland - 15.912
Italy - 63.672
Norway - 15.032
Sweden - 32.805
Belgian e-commerce is dominated by Bancontact, the national debit scheme, which remains by far the favourite online payment method – about 73% of Belgian shoppers prefer Bancontact and 70% use it most often (retaildetail.eu). Credit cards, once top, now take a secondary role mainly for higher-value purchases (pay.com.)

Key Providers and Roles:
Domestic vs international adoption
Domestically, a Belgian online shopper expects to see Bancontact at checkout – it’s a trust signal and caters to local payment habits. International e-commerce players entering Belgium must integrate Bancontact (often via Shopify Payments or Adyen) to localise their offering (retaildetail.eu). Conversely, Belgian merchants aiming cross-border include methods like PayPal and credit cards to accommodate foreign customers who can’t use Bancontact. Thus, Belgian sites serving neighboring markets often support both local and global methods. This dual approach (Bancontact + an international wallet) is common in Belgium’s e-commerce, ensuring both local and cross-border sales are covered.
Switzerland’s payment mix is unusually diverse. Traditionally, bank transfers and invoices have been extremely popular – as of 2023, bank transfers (including pay-by-invoice) were projected to account for ~46% of Swiss e-commerce transactions (pay.com) Cards are also widely used (52% of online transactions, mostly credit cards in online contexts (pay.com). But the biggest shake-up has come from Twint, the Swiss mobile payments app. In recent years Twint has surged to become the dominant online payment method: it’s now accepted in roughly 4 out of 5 Swiss online shops (twint.ch) and counts over 5 million active users in a country of ~8.7 million (pay.com).

Key Providers and Roles:
Domestic vs international
The Swiss market is small but high-spending, and cross-border e-commerce is significant (many Swiss buy from German, French, or global sites). Domestic shops therefore try to offer a mix of local and international methods. For instance, a Swiss webshop will almost certainly offer Twint and PostFinance for locals, but also Visa/Mastercard and PayPal to appeal to everyone (including cross-border shoppers or expatriates). International retailers entering Switzerland often integrate Twint now – given its reach, not having Twint could alienate a big chunk of local customers. At the same time, Swiss consumers use credit cards and PayPal especially when shopping on foreign sites, since those universally work. This dynamic means successful cross-border sellers into Switzerland either enable local methods via a PSP (Adyen, etc.) or rely on the Swiss buyer falling back to a credit card or PayPal. In summary, Swiss e-commerce shows a dual nature: traditional methods (bank transfer/invoice) remain very strong at home (pay.com), but mobile and global solutions are rapidly overlaying to facilitate seamless buying both domestically and across borders.
Denmark is a card-centric country with a twist – nearly every Dane has a Dankort (the national debit card, typically co-branded with Visa), so card payments have long been the norm. In 2024, about 37% of Danish online consumers cited paying by card as their primary method (ecommercenews.eu). Close on its heels, however, is MobilePay, used by roughly 33% of online shoppers as their preferred option (ecommercenews.eu). MobilePay, a mobile wallet linked to card or bank accounts, has become nearly ubiquitous (over 90% of Danes have the app, and virtually all younger adults do (statista.com)). PayPal and other methods exist but are less prominent – a few years ago PayPal accounted for ~13% of Danish online payments (oosga.com), and it remains a common option particularly for cross-border purchases. Overall, Denmark’s landscape mixes global card infrastructure with highly adopted local fintech solutions.

Key Providers and Roles:
Domestic vs International Adoption
Danish online retailers focus on domestic preferences first – supporting Dankort/Visa and MobilePay to cover the vast majority of local transactions. Cross-border, Denmark has a high rate of consumers buying from abroad (over half shop abroad monthly (ecommercenews.eu), so Danish merchants also consider methods that international shoppers use. This means accepting foreign Visa/Mastercards (no problem via standard acquiring) and often keeping PayPal available. International merchants selling into Denmark are wise to enable MobilePay – increasingly, payment platforms (like Stripe or Adyen or Shopify Payments) let them do so easily. We see that cross-border giants (Amazon, etc.) have started to include MobilePay for Danish customers. In summary, domestic Danish e-commerce is characterised by card and MobilePay dominance, whereas cross-border commerce relies more on international card networks and PayPal – but the gap is closing as local methods become accessible to foreign merchants too.
Finnish online shoppers have a strong preference for direct bank payments. Rather than using individual bank buttons, Finland streamlined this through Paytrail, an aggregator that connects all major Finnish banks. As a result, online bank transfer solutions like Paytrail are the top choice for Finns (aboutpayments.com). According to industry info, Finnish consumers most prefer paying via their internet banking through services such as Paytrail or Trustly (aboutpayments.com). Cards are of course used as well, but historically Finland has seen lower credit card usage online than many other European countries. Instead, debit cards via bank transfer and recently mobile wallets are prominent. MobilePay (imported from Denmark) has also gained traction in Finland – it’s available and used by many, though not yet as dominant as in Denmark. Klarna is popular in Finland too (Finland was an early Klarna expansion market), and invoice payments are fairly common for certain purchases. In summary, Finland’s payment scene is a mix of bank-centric methods and a few select international options.
Key Providers and Roles:
Domestic vs International
Finnish e-commerce is quite domestic-focused in method – a Finnish shopper expects to pay through their bank or an invoice. International merchants expanding to Finland often partner with Paytrail or a similar PSP to offer localized bank payments, because without those, they’d miss a large portion of sales. The prevalence of English-speaking Finns means many do shop on international sites, where they might then use a credit card or PayPal if Finnish bank options aren’t available. Indeed, PayPal is accepted on many Finnish sites (though not top-five in preference, it’s present on ~8,300 Finnish webshops per our data), functioning as a catch-all for cross-border transactions (e.g. paying a non-Finnish merchant). Adoption trends show that methods like Paytrail keep domestic transactions flowing in local currency and language, whereas global platforms like PayPal or card networks come into play for cross-border. Additionally, Finland being in the Eurozone makes cross-border shopping easier (no currency swap issues), so credit cards are slightly more used for EU-wide shopping. Finnish merchants, to expand abroad, will lean on PSPs that support international cards, PayPal, and possibly multi-currency – many use Stripe (found on ~4,200 Finnish sites) or Adyen for that reason. In sum, Finland has a strong local backbone (bank payments) that any entrant must integrate, and a willingness to layer global methods on top for broader reach.
Local Payment Landscape: Italy stands out for the prominence of PayPal in e-commerce. Italians have historically been cautious about online payments, leading them to gravitate towards PayPal for its perceived safety and buyer protection. Recent surveys show about 63% of Italian online consumers used PayPal in the past month, and 39% prefer PayPal over any other method – making it the #1 choice by far (rapyd.net). Credit and debit cards are of course used (especially with the widespread CartaSi/VISA and MasterCard), but only ~11% of Italians picked credit cards as their first choice, according to the same study (rapyd.net). Interestingly, a uniquely Italian method, the PostePay prepaid card (issued by the postal service), ranks high – about 12% choose it as their top payment method (rapyd.net). PostePay is essentially a reloadable Visa/Mastercard, and its popularity reflects Italians’ preference for controlled, cash-loaded spending. Cash on delivery (contrassegno) still lingers as an option in Italy for some categories, though its share is decreasing as digital payments grow. Overall, Italy’s online payment mix is a blend of global wallets, card networks (often through domestic brands like CartaSi or PostePay), and some remaining traditional methods.

Key Providers and Roles:
Domestic vs International
Italian merchants historically catered to domestic buyers’ preferences (hence a heavy emphasis on PayPal). Now, with cross-border e-commerce growing (two-thirds of Italian shoppers have bought from international sites (rapyd.net)), Italian merchants are expanding their payment options. Many are adding methods like Amazon Pay (since Italians shop on Amazon’s platforms), or enabling multi-currency credit card processing to attract foreign customers. Likewise, foreign companies selling to Italy have learned that including PayPal at checkout is crucial – a UK or German site that adds PayPal might suddenly convert many more Italian buyers who trust PayPal over entering card details. We see platform-native solutions smoothing this process: for example, Shopify Payments allows a foreign merchant to offer Italian shoppers local payment options (like bonifico via Sofort or appropriate localized card forms) without that merchant needing an Italian banking relationship. Additionally, services like Klarna have recently launched in Italy as well, aiming to introduce more pay-later options; their usage is nascent but growing for cross-border purchases (e.g. an Italian buying from a German shop might use Klarna). In summary, Italy’s e-commerce shows a stark local preference for PayPal and familiar tools, and both domestic and international sellers adjust to that reality – often by prominently featuring PayPal, offering prepaid-friendly options, and maintaining trust signals. The reliance on platform solutions (PayPal, Amazon Pay, etc.) also lowers the friction of cross-border commerce for Italian consumers, effectively bridging domestic habits with international retail.
Norway’s consumers are highly digital and spend a lot online. Card payments are extremely common – in fact, Norway has one of the highest per-capita card usage rates. Cards (debit and credit combined) account for roughly 43% of all retail transactions (online and offline) in Norway (pay.com). The majority of these are through BankAxept, Norway’s domestic debit card system, which is co-branded with Visa/Mastercard for international acceptance (pay.com). Alongside cards, Norway has a very strong mobile payments culture thanks to Vipps, a mobile wallet app used by most Norwegians. Vipps has cornered the digital wallet market in Norway (pay.com), meaning alternatives like Apple Pay or Google Pay are secondary (though available). Klarna and other pay-later options are also popular – Norway, like other Nordics, embraced Klarna early for splitting or delaying payments. PayPal exists but plays a smaller role in day-to-day domestic payments (around 7% share of online transactions as per Norges Bank (pay.com)), used mainly for cross-border shopping. In summary, Norway’s landscape features high card usage with a layer of mobile wallet convenience and BNPL flexibility.

Key Providers and Roles:
Domestic vs International
Norway’s e-commerce players pay attention to both local preferences and the fact that Norway is outside the EU (which affects cross-border trade, VAT, etc.). Domestically, a Norwegian merchant will emphasize Vipps and Klarna alongside cards to maximize conversions – these are what local shoppers expect. Internationally, Norwegian merchants know that foreign customers won’t have Vipps, so they ensure card payments (Visa/Mastercard) and PayPal are available. Many also support Klarna’s global offering in other markets (since Klarna operates across Europe and even the US, a Norwegian merchant can offer pay-later to customers in those countries via Klarna). Moreover, with high English proficiency, Norwegians frequently shop abroad; when they do, they typically use cards or PayPal – indeed PayPal’s main utility in Norway is for cross-border purchases (pay.com). This behavior influences Norwegian e-commerce sites too: for example, the prevalence of PayPal on Norwegian sites is partly to reassure and facilitate sales to non-Norwegians (and to Norwegians who might prefer it in certain situations). Another interesting point is that as part of the Vipps-MobilePay merger, Nordic payment integration is improving – soon a Danish customer might pay a Norwegian shop with MobilePay and it seamlessly works with Vipps (and vice versa). This will strengthen cross-Nordic commerce by leveraging each country’s local wallet. In summary, Norway shows a pattern seen in the Nordics: very high local adoption of innovative payments, and a parallel support of global methods to engage in cross-border commerce.
Sweden’s online payment landscape has two giants: Klarna and Swish. It’s often said that “everyone in Sweden uses Swish,” and that’s barely an exaggeration – about 98% of Swedish adults have Swish installed and ~95% use it regularly (ergomania.eu). Swish is a mobile payment system (bank account-linked) originally for P2P but now widely used in e-commerce and even brick-and-mortar. On the other hand, Klarna’s pay-later services (invoice, installment, etc.) account for a huge portion of Swedish e-commerce – over 50% of online transactions by value are open invoice payments (adyen.com) - many of those facilitated by Klarna and a handful of competitors. Credit/debit cards remain popular too (especially for some online services and travel), but Sweden stands out in that invoices/payment after delivery are the single largest category, surpassing cards (adyen.com). This is rooted in consumer behavior: Swedes historically liked to receive goods and pay by invoice, a practice that fintechs like Klarna turned into a smooth digital experience. Meanwhile, Swish’s instant bank transfers are siphoning off transactions that might have been card or cash. PayPal exists and is used in Sweden, but given the strong local options, it’s not a leading method for domestic shopping. Overall, Sweden is extremely advanced: high smartphone usage, multiple fintech solutions, and consumers comfortable with alternative payments.

Key Providers and Roles:
Domestic vs International: Swedish e-commerce players are very outward-looking (Swedes buy from international sites and Swedish sites sell abroad, especially to the EU). For domestic sales, not offering Klarna or Swish is almost unthinkable for a mainstream merchant – you’d lose too many sales. For cross-border, Swedish merchants rely on those platform capabilities: Klarna is expanding in many markets, so a Swedish merchant can offer Klarna in, say, Germany or the UK to attract foreign customers similarly. Swish, however, is domestic; a non-Swedish customer cannot use Swish, so Swedish merchants must also have card payments and PayPal to cover foreigners. This they generally do – either via a PSP or via Klarna Checkout (which by default shows local Swedish options but can fall back to card for others). International merchants entering Sweden often partner with Klarna to quickly gain local credibility. It’s common for foreign brands launching Swedish sites to heavily feature Klarna and Swish logos – it signals to Swedish shoppers that “you can trust and pay easily here”. Additionally, Sweden’s high trust in fintech means new entrants can get traction – e.g. Stripe is used by many startups in Sweden and can process Swish via plugins, so newcomers can offer Swish with minimal effort. Platform-native solutions like Shopify Payments also support local methods in Sweden (Shopify merchants can enable Klarna and Swish through integrations), which lowers the barrier for smaller foreign merchants to sell to Swedes. A noteworthy cross-border trend is the Nordics integration: with Vipps, MobilePay, and Swish collaborating, a merchant in one Nordic country might soon accept a wallet payment from a neighboring country’s app seamlessly. This will further blur domestic vs international in the Nordic region’s payments. All told, Sweden’s market is characterized by extremely strong local preferences (Swish, invoicing) that any successful player must adapt to, and a parallel accommodation of global methods for complete coverage. Swedish consumers will happily use a local method if available, but if shopping on a foreign site, they might use a card or PayPal – however, their expectation now is that more and more foreign sites will cater to them with Swedish methods.
One recurring theme across all these countries is the role of platform-native payment integrations – especially on popular e-commerce platforms like Shopify and WooCommerce – in streamlining cross-border payment acceptance. Two prime examples are Shopify Payments (with its local method support) and PayPal’s ubiquitous plugins.
Shopify Payments (and Shop Pay)
Shopify Payments is the built-in payment gateway for Shopify merchants, powered behind the scenes by providers like Stripe/Adyen. Crucially, it automatically enables relevant local payment methods based on the shopper’s region. For instance, a Shopify merchant in the US can easily accept Bancontact and iDEAL when selling to Belgium or the Netherlands – they simply toggle those on, no custom integration needed (help.shopify.com). Shopify Payments supports Bancontact, iDEAL, Sofort, EPS, Klarna, etc., depending on the market (help.shopify.com), meaning merchants on Shopify can localize their checkout experience at the flick of a switch. This has huge implications: it lowers the barrier for cross-market expansion since even small merchants can offer country-specific popular methods without in-depth knowledge. Additionally, Shop Pay, Shopify’s accelerated checkout, is available globally – it stores customer details for one-click payments across any Shopify store. Shop Pay itself isn’t a separate payment method funded by a bank or card, but it streamlines card payments and now even installments (Shop Pay Installments by Affirm in some countries). Its presence (noted in our data across countries, e.g. ~6–13k sites in each country had “Shop Pay” enabled) underscores the impact of platform features. Shop Pay improves conversion and thus indirectly encourages merchants to sell globally, knowing returning customers can pay faster. In essence, platform-native solutions like Shopify Payments abstract away complexity: a single integration gives a merchant Apple Pay, Google Pay, local methods and credit cards in one – very powerful for cross-border commerce.
WooCommerce & PayPal/Stripe integrations
WooCommerce (the popular WordPress e-commerce plugin) relies on third-party payment gateways. PayPal and Stripe are two that have become nearly universal on WooCommerce sites globally. Because they are easy to install and free to use (no monthly fee, just transaction fees), many WooCommerce-based shops simply offer PayPal and Stripe out-of-the-box. This means an English WooCommerce site, a German one, or a Danish one – all likely have a similar PayPal checkout option (and Stripe powering card payments). Our analysis of PayPal’s presence found that a significant percentage of Shopify and WooCommerce stores across these countries have PayPal enabled – often 50% or more (e.g. ~72% in Italy, ~47% in Sweden, ~40% in Finland, ~62% in Belgium) based on the data of PayPal usage on those platform stores. This prevalence is no accident: PayPal comes built-in with Shopify and as a default plugin with WooCommerce, so many merchants leave it on as a convenient global method. The result is a kind of cross-market ubiquity – no matter if you’re shopping on a boutique in Oslo or a gadget store in Milan, you’re likely to see the PayPal button. That consistency gives consumers a familiar fallback and gives merchants confidence they can serve international customers (who might prefer PayPal if they’re unfamiliar with the local method on that site). Stripe’s integration on WooCommerce similarly allows merchants worldwide to accept not just cards but Apple Pay, Google Pay, and even local methods (if configured) like iDEAL or Klarna through Stripe. So, platform ecosystems have made a set of payment methods effectively universal across markets.
Cross-Border Influence of Key Players
Certain providers emerge as bridges across countries. PayPal is the obvious one – present virtually everywhere, it’s the default cross-border wallet. Stripe/Adyen as PSPs power many local methods but are invisible to consumers; their influence is in enabling merchants to support the right mix in each market. Klarna has grown from a Swedish BNPL to a global brand now active in all the discussed countries – a German shopper, a Norwegian, an Italian can all use Klarna, making it a cross-border payment option in its own right. Apple Pay and Google Pay – while not top of any country’s list except perhaps on tech-centric sites – provide a unified experience for a segment of users across borders (a tech-savvy Swiss or Italian might choose Apple Pay in lieu of typing card details, for example). Mollie and Nets/Nexi (regional PSPs) are extending beyond their home (Mollie from NL into Belgium, France, etc., Nets from Nordics into DACH), contributing to cross-pollination of methods.
In summary, platform-native integrations and globally-oriented providers smooth out the differences between markets. They ensure that a merchant doesn’t have to integrate Bancontact, iDEAL, Klarna, Swish separately with different contracts – instead, one integration (be it Shopify Payments, PayPal, Stripe, etc.) covers it. This has led to a situation where key payment methods achieve strong cross-border presence despite being local in nature: for example, Bancontact can be accepted by a German Shopify store selling to Belgium, and iDEAL appears on UK websites via PayPal’s Braintree or Adyen. Likewise, a Dutch merchant can easily offer Klarna to German customers through a single PSP. The significance is huge for market entry and expansion: a merchant can enter a new European market and immediately offer the familiar local payment options through their existing platform, rather than needing to sign deals with local banks. This greatly lowers friction in European e-commerce, effectively enabling the regional patterns we’ve discussed to coexist with global e-commerce flows.
Analysing these seven countries side by side reveals clear regional patterns and instructive differences:
Local dominance vs global universals
Each country has one or two dominant local payment methods – Bancontact in Belgium, Twint in Switzerland, MobilePay in Denmark, Paytrail (bank transfers) in Finland, PayPal (local favourite) in Italy, Vipps (and cards) in Norway, Klarna/Swish in Sweden. These methods stem from local banking systems or consumer habits and command loyalty in their home markets. At the same time, global methods like credit cards and PayPal are present “just about everywhere” (retaildetail.eu) as the common denominators. Cards are accepted in all countries (even if not always first choice), and PayPal’s familiar checkout is offered broadly to capture cross-border shoppers. This duality means successful merchants typically combine the local must-haves with a baseline of global options.
North vs south vs central
There’s a north-south divide of sorts. The Nordics (Denmark, Norway, Sweden, Finland) are heavy on mobile wallets and pay-later solutions: MobilePay/Vipps/Swish and Klarna/Svea are household names there, reflecting a tech-forward consumer base and trust in digital finance. Central-West Europe (Belgium, Netherlands, Switzerland) leans on bank-based payments: Bancontact, iDEAL, Twint, Sofort – these are all bank-account-direct methods, indicating the strength of bank networks and a preference for direct debit-style payments. Southern Europe (Italy) has been more cautious historically, thus PayPal (a “foreign” but trust-building method) and cash/prepaid solutions took hold. Understanding these cultural and historical contexts is key – one size does not fit all in Europe. A Nordics-focused merchant will prioritise mobile wallets and Klarna, whereas a Benelux-focused one must integrate local bank payments or risk losing most customers.
Cross-border influencers – key players
Some payment providers have clearly managed to extend their influence across multiple countries: Klarna (originating in Sweden) is now a major player in Norway, Finland, the Netherlands, Belgium, etc., showing that a popular concept can travel – especially BNPL in regions with similar consumer credit cultures. PayPal remains a pan-European staple for cross-border commerce – even where it’s not #1 locally, it’s the safety net for transactions that cross languages or currencies. Stripe and Adyen (though behind the scenes) power a lot of this by enabling local method acceptance to non-local merchants – they are the unsung heroes making, for example, a French website feel native to a Dutch customer by offering iDEAL. Mollie has grown beyond the Netherlands into Belgium and even across Europe, thanks to its easy integration – it’s becoming a regional champion for SME payments. Meanwhile, regional collaborations (like the Vipps-MobilePay merger and its partnership with Swish) hint at the future: key local methods might interoperate across borders, effectively becoming multi-country methods. If that succeeds, a Nordic wallet could rival card schemes in cross-border utility within that region.
Platform power – shaping market entry
The prevalence of Shopify, WooCommerce, Magento, and other platforms in online retail has greatly shaped how payments are adopted. These platforms have baked-in support for the dominant providers, which means merchants expanding to a new country often have the tools at their fingertips to accept the local payments. For example, a Canadian brand using Shopify entering the Dutch market can enable iDEAL and Bancontact via Shopify Payments in minutes – something that would have been a project on its own a decade ago. This reduces the friction of market expansion; payment localization is no longer a barrier reserved for enterprise retailers with local contracts, but available to SMBs. It also means that certain payment methods achieve widespread adoption simply by being defaults on platforms – PayPal’s presence on WooCommerce is a clear case. In effect, the e-commerce platforms act as conduits for spreading payment innovations across borders. If tomorrow a new payment method becomes huge in one country, chances are platform providers or PSPs will integrate it and thereby propagate it across thousands of merchants in multiple countries (much like Apple Pay rolled out or Klarna became a checkout option globally).
Consumer behaviour and trust
Underpinning all of this, local consumer behaviour and trust patterns dictate what gets used. In Belgium and Netherlands, trust in one’s bank and domestic systems is high – hence bank-based methods flourish. In Italy, wariness about fraud led to a trust in PayPal and cash – only now gradually shifting toward more modern solutions as trust improves. Nordics have high trust both in technology and in credit, enabling things like Swish and Klarna to thrive. These patterns highlight that any payment provider trying to enter a new European market must contend with deeply ingrained habits. Often, partnering or integrating with existing local systems (as Mastercard did by co-badging Bancontact, or as Klarna did by offering localised invoice terms) is more successful than trying to impose a wholly new behaviour.
To conclude, European e-commerce payments are a mix of local traditions and global tech. Merchants aiming for success across these markets need to literally “speak the language” of payments in each country – be it offering installment invoices in Sweden, MobilePay in Denmark, or Bancontact in Belgium – while also providing cross-border staples like cards and PayPal to ensure no customer is left out. The good news is that modern payment platforms and providers have made this mapping far easier. The direction is clear: meet customers’ local expectations at checkout, and they will buy confidently, whether they’re next door or across the continent. By recognizing the strengths and focus of each payment provider (from Twint’s local sovereignty in Switzerland to PayPal’s cross-border indispensability), businesses can craft a payment strategy that feels native in every market they serve, B2C and B2B alike. This localized approach, backed by data and smart integrations, is increasingly what defines competitive advantage in Europe’s vibrant online payments landscape.
Cross-border online sales are an important growth channel for webshops in Europe’s integrated market. This article examines why certain international sales corridors dominate for e-commerce merchants in five European countries – the Netherlands, Germany, Denmark, Italy, and Sweden. We analyse the top export markets of webshops in each country (based on provided top-10 destination data) and explore the factors behind these patterns, including geography, language, economic ties, consumer behaviour, and logistics integration. We also benchmark the maturity of each country’s e-commerce sector (webshop density and online-selling share).The goal is to provide European e-commerce professionals with insight into existing cross-border flows and how to leverage them.
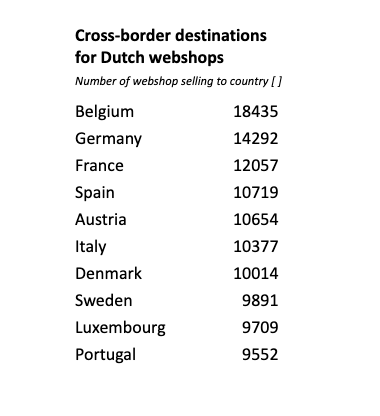
Dutch webshops are remarkably outward-looking, with nearby Belgium and Germany as the top destinations for online exports. Belgium tops the list (a large portion of Dutch cross-border orders), thanks in part to shared language (Dutch is spoken in Flanders) and immediate proximity facilitating quick shipping. Likewise, Germany – Europe’s largest e-commerce market – is a close neighbor and a natural target for Dutch retailers. Geographic centrality and excellent logistics infrastructure in the Netherlands (Rotterdam port, Schiphol airport) make it a hub for distributing goods across Western Europe, so Dutch webshops easily serve France, Spain, and Italy as well (ecommercegermany.com). Many Dutch merchants localise in English or multiple languages, leveraging the population’s high foreign language proficiency. These factors, combined with the Netherlands’ high Internet penetration and consumer spending, explain why Dutch online sellers extend their reach broadly into Europe. The cross-border focus is diverse, but the Benelux and adjacent EU markets dominate Dutch e-commerce exports.

German webshops tend to have a more regional cross-border focus, reflecting Germany’s huge domestic market which somewhat lessens reliance on exports. Nevertheless, German retailers mainly ship to German-speaking neighbours, especially Austria (the top export market) and Switzerland, as well as the Benelux countries (ecdb.com). Austria’s shared German language and culture make it a natural extension of the domestic market, and indeed over half of Austria’s cross-border e-shopping is from Germany (ecdb.com), illustrating this tight linkage. Similarly, a high share of Luxembourg’s online imports come from German sites (ecdb.com), aligning with Germany listing Luxembourg among its top export destinations. Beyond these, German e-sellers target large EU economies like France, Italy and Spain, but volumes there are lower relative to Germany’s size. Geographic proximity and EU single-market ties play a key role – Germany’s neighbours (Austria, Netherlands, France, Poland, Denmark, etc.) comprise most of its top 10 export markets. While Germany has the most e-commerce sales in Europe, its cross-border activity (in percentage terms) is more modest than smaller countries’, as its home market is very self-sufficient. Still, German webshops capitalise on being in the center of Europe by serving nearby countries with minimal barriers.
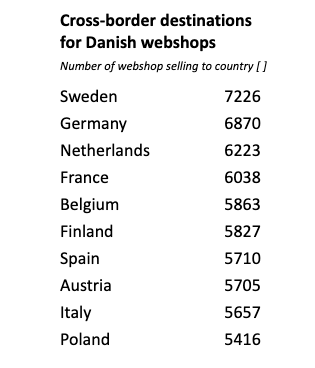
Denmark’s online retailers are highly oriented toward Nordic and nearby EU markets. The top export destination is Sweden, Denmark’s neighbour across the Øresund bridge, reflecting strong regional integration. Danish merchants benefit from cultural and linguistic affinities within Scandinavia (Danish and Swedish are mutually intelligible to a degree), and importantly from a merged postal network (PostNord) that eases Denmark–Sweden deliveries. Germany is the second-most common destination for Danish webshops – a logical outcome of geographic adjacency and Germany’s market size. Other top targets include the Netherlands, France, and Belgium, indicating Danish online retailers don’t confine themselves to Scandinavia. High English proficiency in Denmark and use of international e-commerce platforms enable even small Danish webshops to sell into distant European markets. Finland and Norway also appear in Danish sellers’ top corridors, consistent with a Nordic e-commerce cluster. In sum, proximity and regional ties drive much of Denmark’s cross-border trade, but Danish companies’ agility and the necessity to grow beyond a small domestic market push them to court major economies across Europe as well.

Swedish webshops likewise show a strong Nordic focus coupled with EU-wide reach. Denmark and Finland rank among the top export markets for Sweden’s online retailers, owing to Sweden’s position bridging Nordic neighbours (and sharing a land border with Finland). Cross-border commerce within the Nordics is bolstered by relatively aligned consumer habits and the prevalence of English, though language differences (Swedish vs. Finnish) still pose some barrier. Sweden’s list of top e-commerce export destinations also features Germany, the Netherlands, France, Spain, and Belgium, mirroring a broad Western European outreach similar to Denmark’s. Sweden’s e-merchants benefit from being in one of Europe’s most digitally mature societies, and they leverage efficient logistics links (for example, ferry routes and international carriers) to serve far-flung customers. Still, the easiest wins are nearby: Denmark alone accounts for a significant share of Swedish cross-border online sales, exemplifying how regional integration (e.g. PostNord’s bi-national network) underpins cross-border e-commerce in Scandinavia.

Italian webshops, operating in a large but traditionally less digitized market, concentrate their cross-border sales on Europe’s biggest economies and nearby countries. Germany is the number-one export destination for Italian online sellers by volume, followed closely by France and Spain, which together account for a large majority of Italy’s e-commerce exports (amavat.eu). This reflects both geographic proximity (France and Austria border Italy, and Germany is just beyond the Alps) and strong demand for Italian products (e.g. fashion, design, food) in wealthier EU markets. Austria is another key corridor (benefiting from adjacency and a shared German-language business environment), and neighbors Switzerland and Slovenia (not in the top-ten list provided, but likely significant) also draw Italian exports. Interestingly, Northern European markets like the Netherlands, Belgium, Denmark, Sweden and Poland appear among Italy’s top export destinations as well – indicating that Italian brands have appeal across Europe despite distance. Italy’s cross-border e-commerce has been surging in recent years, growing its share of total online turnover from ~29% to 39% between 2019 and 2022 (amavat.eu). However, Italian webshops are relatively fewer per capita, so much of this cross-border activity is driven by a subset of competitive firms (often via marketplaces). In summary, Italy’s e-commerce exports gravitate toward large EU consumer markets and nearby neighbors, leveraging Italy’s renowned products, even as the domestic e-commerce sector catches up in maturity.
Despite national nuances, these five countries share some common patterns. Neighboring countries dominate cross-border e-commerce flows in many cases – a classic gravity effect where shorter distances, lower shipping costs, and familiar cultures facilitate trade. For example, the Netherlands-Belgium, Germany-Austria, and Denmark-Sweden corridors are all top-ranked, underscoring the importance of geographic proximity and shared language or cultural ties. This aligns with research finding that even online, distance and cultural/language factors still significantly impact trade (though less than offline) (econstor.eu). Additionally, all five nations see major EU economies (Germany, France, Spain) in their export mix. These large markets are attractive targets due to their sheer number of online shoppers – Germany and France are among Europe’s top destinations for cross-border e-commerce imports (ecommercegermany.com). In fact, German consumers are so pivotal that every country’s webshops list Germany as a top-3 foreign market (except Germany itself), and German shoppers account for a sizeable share of many neighbour's’ online sales (ecdb.com).
However, there are clear differences in scope. The smaller, digitally advanced countries (Netherlands, Denmark, Sweden) tend to export to a broader array of markets across Europe, reflecting their need to go global to scale beyond limited domestic populations. Their top-10 lists include more distant EU distinations – enabled by strong English usage and pan-European platforms. In contrast, Germany and Italy (the larger markets) show a relatively more regional focus, concentrating on immediate neighbors and a few key economies. German webshops’ cross-border sales are more regionalized (e.g. mostly EU neighbors), and Italy’s exports tilt heavily to Western Europe (with limited Nordic focus). Another difference is the reciprocity of corridors: e.g. Denmark and Sweden mutually rank each other very high, whereas Italy and Germany have an asymmetry (Italy relies on Germany more than Germany on Italy). This hints at differing product specializations and consumer preferences driving flows one way more than the other. Finally, language plays a part – shared language pairs (Dutch-Flemish, German-Austrian, Scandinavian languages) clearly boost mutual e-commerce, whereas language barriers can limit cross-border reach unless sellers localise (which not all Italian or German SMEs do as readily as Nordics). Overall, all five countries leverage the borderless EU market, but the extent of their reach and the partners they prioritize vary with their size, culture, and e-commerce sophistication.
The strength of a country’s e-commerce sector underpins its cross-border capabilities. Two useful indicators are the number of webshops per capita and the share of companies engaging in online sales. Below is a brief benchmark of the five countries:
Even as shipments cross borders, the “last mile” must cater to local preferences. Logistics firms should note that a Danish package destined for Sweden or a Dutch package to France will require localised last-mile handling – from language-specific notifications to preferred delivery methods (locker pickup, home delivery culture, etc.). Adapting delivery options to the recipient country’s norms increases success. For instance, offering Pakketboxen or parcel lockers in the Netherlands/Belgium, home delivery with SMS coordination in Germany, or convenient pickup points in Sweden/Denmark can improve customer experience. Cross-border delivery success is not just about moving goods across distance, but also navigating the “last kilometre” in a foreign context. Providers may need to coordinate returns handling across borders as well, given high return rates in e-commerce – setting up return logistics in the top destination countries can be a competitive advantage for carriers serving exporters.
In conclusion, understanding these dominant cross-border sales channels allows logistics and last-mile providers to align their networks with e-commerce trade flows. By focusing resources on key routes, integrating services regionally, and tailoring last-mile delivery to each market’s needs, providers can improve efficiency and customer satisfaction. The European e-commerce landscape is increasingly interconnected – especially within regional clusters – and logistics firms that adapt to these patterns will be well-positioned to serve both the booming cross-border volumes and the merchants driving them. Ultimately, the continued growth of cross-border e-commerce (nearly €171 billion in Europe in 2021, or ~25.5% of online revenue (ecommercenews.eu)) relies on frictionless logistics. Providers who innovate on these busy corridors will not only reduce costs but also strengthen the entire e-commerce ecosystem across Europe’s borders.
Last‑mile delivery shapes the online shopping experience, influencing conversion rates, repeat purchases and brand perception.
At Tembi, we analysed over 600,000 webshops to understand two aspects of last‑mile competition in 17 European markets, the market share of the top delivery provider and the number of distinct delivery partners each webshop integrates, and how these factors drive innovation and strategy.

Rather than estimating parcel volumes, we examined the presence of delivery providers in webshop back‑ends. Every integration represents a commitment by the webshop to offer that carrier at checkout. By counting integrations, we capture:
• Breadth of choice available to consumers
• Carrier prominence within each market
For each country - from Belgium to Slovakia - we identified the top three providers by share of webshop integrations and counted the total number of providers in active use. We excluded providers that have less than 1% market presence.

These figures show that while national postal services still lead in many markets, no single carrier dominates everywhere, and the number of options ranges from three providers in Iceland to more than twenty in the Netherlands.
We classify markets by the checkout presence held by the leading provider:
Adding the count of distinct delivery partners shows where compeition is the hightst:

Most fragmented markets, such as the Netherlands, Romania and Sweden, offer webshops a broad selection of carriers to tailor delivery options by region, price‑point and service level. In the Netherlands, for instance, there are over twenty distinct last‑mile providers active across the market. By contrast, in Iceland and Bulgaria webshops have fewer providers to choose from, simplifying management but concentrating risk, and less consumer choice. Finland sits between these extremes, with around fourteen partners in use yet Posti being present in 62% of all webshop checkouts.
Geography plays a crucial role in shaping last‑mile dynamics. In countries with vast rural areas and archipelagos - most notably Finland and Sweden - webshops need delivery partners that can reliably serve both remote villages and dense urban centres. National posts excel at this: Posti’s 62 percent presence in Finland and PostNord’s 33 percent in Sweden reflect their ability to cover every corner of the country, from Lapland to the Helsinki suburbs, or from the Stockholm archipelago to the far north. This extensive network cements their leadership and makes it challenging for smaller couriers to compete on a truly national scale.
At the same time, urban populations in these markets demand faster and more flexible options. That’s why even highly consolidated markets like Finland still see around fourteen delivery partners in use, and Sweden nearly eighteen. Specialist providers focus on city‑centre same‑day deliveries, parcel locker networks and niche eco‑services, carving out space alongside the national postal incumbent.
By contrast, in highly fragmented markets such as the Netherlands, Italy and Romania, geography is less of a barrier - population density is higher and distances shorter - so webshops routinely offer 18 to 22 different providers to meet varied consumer preferences. National posts such as PostNL and Poste Italiane must innovate continually, rolling out premium services like carbon‑neutral shipping, click‑and‑collect lockers and advanced tracking, and partnering with crowd‑shipping or on‑demand couriers to fill gaps.
In moderately consolidated markets - Denmark, Belgium, Switzerland and the Baltics - the mix reflects mid‑range geography and market size. National posts share the stage with regional specialists (such as GLS and DPD), driving innovation in service differentiation, tech integration and sustainability (electric fleets, bike couriers, offset programmes).
Finally, in smaller or more remote markets like Iceland and Bulgaria, webshops often layer core postal services with a handful (three to five) of local same‑day or on‑demand couriers to ensure coverage. Even here, national posts are expanding parcel‑locker footprints and app‑based tracking to meet rising consumer expectations - while keeping a watchful eye towards rapidly growing new digital-first ventures.
Understanding these overlapping factors - market consolidation, provider fragmentation and geographic realities - allows e‑commerce leaders to tailor last‑mile strategies. In widespread, low‑density regions, deep partnerships with national posts ensure full coverage; in dense, competitive markets, robust multi‑carrier technology and innovative niche services deliver the flexibility consumers expect.
Stay tuned for more insights and sign-up to our monthly newsletter.

or e-commerce consumers, delivery costs often represent the final hurdle before completing a purchase. Set too high, delivery fees can drive potential buyers away; priced competitively, they can boost conversions and foster customer loyalty. At Tembi, we closely track these shifts, monitoring what webshops across Europe charge consumers for different delivery methods.
We analysed webshop delivery pricing data across nine markets from October 2024 to March 2025, examining variations across three key delivery methods: parcel box, parcel shop, and home delivery.
Over 300.000 webshops are part of this analysis and we've removed the outliers when calculatin average deliver prices (free delivery and delivery of large and/or heavy objects).
%403x.jpg)
Parcel boxes have become a popular choice due to convenience and lower operational costs. However, pricing varied significantly:
Parcel shops offer flexibility for consumers who prefer to pick up orders at convenient locations:
Home delivery remains the premium service and is generally priced highest:

These shifts in delivery prices reveal strategic decisions by webshops rather than direct changes in logistics provider pricing. Webshops balance several factors:
For commercial leaders in e-commerce, understanding these pricing strategies is critical. Lower delivery prices may indicate aggressive market positioning or efficiency gains, while increases might signal tighter operational conditions or reduced competition.
Webshop delivery pricing is a powerful indicator of market conditions and consumer expectations. Regular monitoring of these shifts is essential to stay competitive and agile - regardless if you're a retailer selling directrly or inderictly, or operate a last-mile delivery provider.
hen we talk about e-commerce opportunity, the conversation often starts, and ends, with the size of a market. How many webshops are there? Which countries have the highest absolute numbers?
At Tembi, we believe that raw totals only tell part of the story. To really understand where e-commerce is thriving, and where it’s just starting to take hold, you need to look at density, digital integration, and market readiness.
We recently analysed data across 20+ European countries, looking not only at total webshop numbers but how they compare to population size and national business ecosystems.
Some of the results are surprising:

Knowing how many webshops exist per capita or per company tells us more than just the size of the e-commerce sector. It signals how deeply online sales are embedded into the economy.
For commercial teams, this is essential context. Are you entering a market where most companies already sell online? Or one where there’s room to help businesses go digital? Are you facing established competitors, or discovering a still-fragmented field?
This kind of intelligence can shape your go-to-market plan, sales motions, and even your product localisation strategy.
In short: don’t just look at the number of webshops. Look at who they serve, how they scale, and how densely they operate within the economy. Because the future of e-commerce isn’t just about growth -it’s about depth, integration, and staying power.
hen evaluating market opportunities, many look at total size. But total size doesn’t tell you where momentum is building. New webshop creation - and survival - is often a better indicator.
Despite being considered mature digital markets, across Denmark, Sweden, Finland, Norway, and Iceland, 9,200 new webshops were launched in 2024 that are still active today. That’s not total launches, that’s survivors - which gives a better sense of which markets are currently supporting new players.
This challenges conventional wisdom about market saturation and highlights untapped opportunities in the region.

Sweden leads with the strongest growth, showing a 42% increase in the number of newly launched webshops that remain active compared to the previous year. Close behind is Denmark, with a 39% year-on-year growth. These figures suggest that both markets are currently fertile ground for e-commerce newcomers, despite heightened competition and shifting consumer behaviour.
Finland and Iceland also recorded positive, albeit more modest, developments. Finland saw a 14% increase in surviving new webshops, while Iceland posted 13% growth. These numbers may not be as dramatic as Denmark or Sweden, but they still point to a healthy pace of new market entrants that are finding ways to stay afloat.
Norway, by contrast , is the only market that moved in the opposite direction. Here, the number of newly launched webshops that remained active declined by 2% compared to the previous year. While not a steep drop, it stands out in a region otherwise trending upwards. This downturn was primarily concentrated in one category - Beauty & personal care - which appears to have experienced a wave of closures (more details on this in our previous blog post available here).
The contrast between countries suggests that, even within a shared economic region, local market dynamics and category-specific pressures can lead to different outcomes.
At first glance, it may seem contradictory: high closure rates alongside a surge in new webshop launches. Between August 2024 and February 2025, over 3,300 Danish webshops ceased activity. That’s 11% of the total market, gone in just six months. This might suggest a market in retreat struggling with saturation. But the full picture tells a different story.
In the very same period, 2,645 new webshops were successfully launched and remained operational. These aren’t just test stores or dormant domains. These are active webshops that made it past the initial setup phase and into actual trade.

One of the more common assumptions about Nordic e-commerce is that the market is saturated. With strong category leaders and high consumer expectations, it can appear that there is little room left for new entrants. However, the consistent entries of still active webshops launched in 2024 challenges that thinking.
These are not just short-lived experiments or weekend projects. They are businesses that have managed to find customers, generate sales, and carve out a place in the market.
In addition, sustainability is playing an increasingly influential role in shaping consumer choices. According to PostNord’s 2024 report, 8 out of 10 Nordic shoppers consider sustainability when making purchases. This creates space for newcomers with strong brand values, circular business models, or second-hand offerings, which are becoming more popular particularly in fashion.
This also presents strategic opportunities for established brands. The new entrants create a pipeline of potential partners, collaborators or acquisition targets. For incumbents, this is a chance to stay ahead of the curve by aligning early with brands that may become the next category leaders.
For entrepreneurs, the lesson is that everything is still very much possible. While competition is strong, the path to growth remains open to those with a clear proposition answering real customer needs. Differentiation, specialization, and a willingness to build something that doesn’t look like everything else on the market will again prove to be key advantages.
Rather than signaling saturation the current trends reflect a dynamic market. New players continue to reshape what is possible, and the space for innovation remains open.
At Tembi, we track over 600,000 webshops across Europe, updating our database bi-weekly to gather historical data and monitor the development of each webshop.
Most of us can name the biggest online retailers—but what about the thousands of smaller webshops that make up the real fabric of e-commerce? In Denmark alone, a country of just under six million people, there are over 30,000 webshops actively selling products online. And if we include service-based and other categories, the number climbs beyond 40,000.
That prompted us to ask: how many of these webshops are actually surviving?
By comparing webshop and company data from August 2024 to February 2025, Tembi identified over 3,300 webshops that had ceased activity. That represents 11% of the total market - a significant churn, even if mostly made up of small to medium-sized players.
In the last 6 months in Denmark:
This does not signal an 11% drop in e-commerce overall, but it does indicate high volatility - particularly among smaller players.

Looking at category distribution, Clothes and Shoes make up 13.2% of all Danish webshops, followed by Furniture at 10.2%.
When we analysed closures, the category that took the biggest hit was also Clothes & Shoes, with 530 webshops closed - accounting for 16% of all closures. Beauty & Personal Care and Furniture followed, with around 170 closures each.
This aligns with overall category size: more webshops in a category generally mean more closures. But fashion clearly over-indexes in both size and risk.

Fashion e-commerce is fiercely competitive. Dominated by global players and shaped by constantly shifting consumer preferences, it also faces the operational challenge of seasonal inventory cycles.
To stand out, local brands need a differentiated marketing approach. But with advertising costs rising sharply, that’s easier said than done. It’s not uncommon for B2C fashion stores to increase their spend by 20% just to maintain business-as-usual - often still being outbid by global giants. This forces a tough choice: either reach fewer customers or spend at unsustainable levels.
Add to this the so-called Temu effect. Chinese dropshipping marketplaces like Temu use aggressive, loss-leading strategies to offer ultra-low prices. Danish webshops can’t compete without sacrificing quality or profitability. Even environmentally conscious shoppers can be swayed by endless product options at rock-bottom prices.
Each of these pressures is significant on its own. Together, they create a perfect storm of market conditions that are difficult for local fashion players to survive.
While furniture hasn’t been hit by dropshipping platforms in the same way, it faces a different challenge: logistics.
Shipping large, heavy items is expensive. Rising freight costs in 2024 made margins even tighter. Add in the complexities of delivery windows, assembly services, and returns, and it becomes tough for smaller players to compete with established brands that can absorb those costs or optimise operations at scale.
While we can't say shipping prices are solely to blame for rising closure rates in this category, they are a critical factor impacting profitability.

With over 50% of Danish consumers buying clothing online, and nearly 40% purchasing shoes, these categories are massively popular—and saturated.
Not every webshop can survive in such a crowded, price-sensitive market. Despite relative economic stability, consumer confidence in Denmark remains cautious. Reports from BCG and Nordea show low discretionary spending, which hits fashion and beauty especially hard.
An 11% closure rate may sound alarming, but it’s not entirely surprising. Tools like Shopify and WooCommerce have made it incredibly easy to launch a webshop - sometimes in less than a day. But low barriers to entry also mean low resilience. The easier it is to start, the easier it is to fail.
While a few large retailers have gone under, our data suggests that the majority of closures come from small and medium-sized businesses.
Still, it’s not all bad news. Over the same period, 2,645 new webshops were successfully launched. So while the market is churning, it’s also replenishing.
E-commerce is dynamic, and understanding it requires continuous tracking. At Tembi, we monitor 600,000+ webshops across Europe, updating our database bi-weekly. This enables us to:
Because in a market that never stands still, real-time intelligence is your competitive edge.
e’re excited to share that Tembi has officially launched in Germany, bringing our e-commerce intelligence to one of Europe's largest markets. With Germany now on board, Tembi covers 17 markets, offering commercial teams actionable insights to drive strategic decisions and accelerate growth.
At Tembi, our approach goes beyond basic data collection. Over the past month, our system has visited and analysed more than 500,000 websites, systematically verifying each one. Through this process, we identified and validated over 94,800 genuine, operating webshops - ensuring that our insights are based on high-quality, accurate data. Each webshop is individually assessed, capturing detailed insights into their operations, product offerings, and category performance. This level of precision provides commercial teams with unmatched visibility into Germany’s e-commerce landscape, helping them pinpoint exactly where to focus their efforts - whether strengthening their local presence or expanding internationally.

Our robust intelligence monitors the technology stack of webshops, including commerce platforms like Shopify, WooCommerce, Shopware, ePages,AVADA, and Magento, as well as other software solutions they use. This empowers businesses with clear insights to strategically optimise their tech infrastructure and drive growth.
Tembi’s comprehensive analysis of the German market includes:
• Last-mile delivery marketshare - identifying logistics providers, delivery methods and prices for every webshop.
• Tracking of payment providers used by webshops, including PayPal, Klarna, Google Pay, Apple Pay,Sofort, Shopify Pay, ShopPay, and Opay (and many others).
• Webshop growth data andproduct sold, revealing emerging market trends and growth opportunities.
This launch highlights Tembi's dedication to delivering verified, actionable e-commerce intelligence that helps commercial teams proactively identify growth potential and optimise their strategies in Germany and beyond.
Keep an eye out for future updates, insights, and trends straight from Europe's e-commerce hub.
Want to know more? Reach out to our sales team.

Clerk.io is a leading e-commerce personalisation platform, helping thousands of webshops optimise their customer experience through tailored product recommendations, search, and email personalisation.
Clerk.io needed to address two main challenges:
Christian, Head of Lead Generation at Clerk.io, explained: “We were looking for a solution to scan markets and get a clear understanding of their potential. At the same time, we needed to ensure the leads we pursued met specific criteria, like being transactional webshops. Our previous provider couldn’t consistently deliver on these fronts.”
Clerk.io turned to Tembi to tackle these challenges. With Tembi's market data & intelligence, the team gained access to:
Christian highlighted the impact: “Tembi gave us a market feeling. For example, in Norway and Sweden, we could see the potential and decide if this was something we should double down on. The data helped us make informed decisions about where to focus our sales efforts. And 98% of the leads we identified via Tembi were qualified, allowing us to focus on high-quality opportunities without loosing time on irrelevant prospects.”
1. More Accurate Leads. By leveraging Tembi's validation process and advanced filtering tools, Clerk.io increased the accuracy of its leads.Only 1% were unqualified, and another 1% didn’t match the ICP criteria.
2. Time savings. Manual qualification time was massively reduced, allowing the team to allocate resources more effectively.
3. Market viability assessments. Clerk.io used Tembi to assess markets likeNorway and Sweden, deciding where to prioritise their efforts for maximum growth potential.
“Tembi made qualifying leads less time-consuming, and the time savings alone justified the investment,” said Peter, Head of Marketing at Clerk.io.’
Beyond the technical aspects, Clerk.io found their collaboration with Tembi to be seamless and productive. Peter Tullin, CMO at Clerk concluded: “We’ve been very happy with Tembi. It was a seamless collaboration, and their local Copenhagen office made it even easier to work together.”

hen starting a webshop, you have two options: build a custom site from scratch or choose a ready-to-go commerce platform to manage inventory and sell products or services online. Given that webshops have existed since the early days of the internet, there are now numerous providers catering to both entrepreneurs and established businesses.
A variety of commerce platforms power European webshops, from large international providers like Shopify and WooCommerce to smaller local specialists such as Dandomain in Denmark and Voog in Estonia. Larger platforms often offer the benefits of scale, while local providers might offer specialized solutions and compliance with regional regulations that enhance scalability.
Choosing the right platform is not just important for those building webshops, but also for the ecosystem surrounding commerce platforms. Not all plug-ins and solutions are compatible with every framework, and understanding a platform’s market penetration can be a strong indicator of its success and investment in that region.
In this article, we take a deep dive into the most widely used commerce platforms across 10 European markets, examining which solutions are the most popular. It’s likely no surprise that Shopify and WordPress’s open-source WooCommerce plugin dominate, but who are the other key players?

Looking at Switzerland, The Netherlands, Slovakia, Denmark, Finland, Sweden, Norway, Lithuania, Latvia and Estonia we’ve identified a total of 242.061 active webshops. With over 100.479 webshops, or 32%, Shopify is trailing behind WooCommerce with 9%. Looking at these 10 markets, WooCommerce is today the preferred e-commerce platform with around 129.480 webshops.
The fact that we only identified 6.682 custom-built webshops (2,1% of the dataset), shows just how powerful commerce platforms are today, where both large and small webshops can benefit from the platform's investments in technology and solutions that make it easy, and possible, to operate and grow a business online.
Before diving into the specifics of each market’s platform penetration, let’s quickly explain how we gather and maintain the quality of this data.
Monitoring hundreds of thousands of webshops on an ongoing basis demands a robust validation process to maintain high-quality data. At Tembi, we automatically filter out inactive webshops, businesses in bankruptcy, and webshops not registered as official companies, and we can only to this by actually visiting the webshops and analyze their operations continuously. We’re not B2B lead list generation company per se, but our data is used by many companies to improve sales and help identify business opportunities.
Once the validation process is complete, and we’ve analyized the webshops products, our system categorizes each webshop into a product category and enriches the data with for example website traffic data and company data.
If you're interested in learning more about how our technology works, be sure to check out our article: Insights from every Webshop on the Market
Having looked how the distribution looks over 10 European countries, let’s examine which E-Commerce platforms are popular in each country and see what insights we can uncover into regional preferences and market trends.

In Denmark, we can find a total of 32.720 webshops. We have identified that 13.567 webshops are built using WooCommerce, and 11.703 are built with Shopify. Just as it also shows in the picture of the ten European markets, WooCommerce and Shopify power the majority of the webshops. The remaining 24% (7.450 webshops) utilize various other providers. With 2.164 webshops, Dandomain stands as the third most used platform in Denmark, likely due to its local roots and strong integration with popular hosting services in the country.

Estonia has a total of 8.568 webshops, with WooCommerce as the clear market leader. WooCommerce is used by 5.846 webshops, representing 68% of all Estonian market. In second place, like in most markets, Shopify follows, but with only 9% of the market, totaling 739 webshops. WooCommerce’s strong presence in Estonia gives it the highest market share in the group of the analysed countries. In third place we find the local e-commerce platform, Estonian Voog, powering 570 webshops. Voog offers native language support and is perfect for small to medium-sized companies, which could also explain why WooCommerce owns such a big portion of the market.
The remaining 23% of E-Commerces, without the ones using WooCommerce and Shopify, are built using various other providers (1.983 webshops).

Finland has a total of 15.092 webshops, with WooCommerce and Shopify being the market leaders. 6.953 webshops in Finland use WooCommerce (45% of the Finnish market), while Shopify is used by 4.014 webshops, accounting for a 26% market share.
The remaining 28% (4,125 webshops) utilize various other providers. Notably, 644 webshops (5% of the market) are custom-built, highlighting a segment of businesses opting for fully tailored E-Commerce solution. With a strong tech and design culture, Finnish businesses likely leverage local expertise to create bespoke solutions cater directly to their target market. MyCashFlow, a Finnish E-Commerce Platform, is the third most used one in the country, accounting with 1.327 webshops, a 9% of the total.

There are 4.903 webshops in Latvia. Of this number, 1.841 webshops are built with WooCommerce (37% of Latvian webshops) and 1.201 webshops are built with Shopify (24%). The other 1.861 webshops (38%) use different providers.

Lithuania has a total of 12.077 webshops, with WooCommerce as the most popular platform, powering 6.568 stores, or 55% of the market. Shopify is the second most used (2.198 webshops) making up 18% of Lithuanian online stores. The remaining 26% (3.311 webshops) use various other providers, with PrestaShop ranking third, supporting 1.506 webshops and capturing 12% of the market. As we can see, PrestaShop ranks very closely to Shopify. We see how two Lithuanian E-Commerce platforms, such as Shopiteka and Verskis, are too the most used ones.

The Netherlands have a highly developed E-Commerce market with 81.224 webshops. WooCommerce has by far most clients, powering 38,316 stores, or 46% of all online shops. Shopify follows with 21,534 webshops, accounting for 26% of the market. The remaining 27%, or 21.374 stores, are distributed across various other providers.

Norway has an E-Commerce market with 13.469 webshops. WooCommerce leads the way, powering 5.346 webshops, or 39% of the market. Shopify is a close second, used by 4.931 webshops, making up 36% of the market. The remaining 24%, or 3.192 webshops, utilize various other providers. The competition between Shopify and WooCommerce is tight in Norway, with only 415 webshops more (a 3%) built with the latter. The third one is MyStore, an E-Commerce provider created in Norway.

There are 15.429 webshops in Slovakia. WooCommerce leads the market, powering 6.399 of these webshops, accounting for 41%. Shoptet follows with 3.502 webshops, making up 22% of the market. The remaining 36%, or 5.528 webshops, are built using a variety of other providers. Slovakia’s case is specially interesting, as Shopify is not the second choice. In its place we find Shoptet, a Czech platform that offers marketplace integrations to the Central European market. This can be relevant for companies looking to increase visibility and brand recognition in the region.

Sweden's E-Commerce landscape is strong, with a total of 31.588 webshops. WooCommerce has a solid position on the market, powering 13.293 of these stores, or 39%, showcasing its popularity among Swedish businesses. Shopify isn’t far behind, with 11.354 webshops, making up 34% of the market. The other 6.941 webshops, representing 26%, use a variety of different providers. We find similar data in Norway, the competition between WooCommerce and Shopify is close, with only a 4% market share of difference (roughly 2.000 webshops).

Switzerland is home to 26.991 webshops, with WooCommerce and Shopify leading the market. 12.168 of these webshops are built with WooCommerce (45% market share), making it the most popular E-Commerce platform in the country. Shopify follows closely, with 9.841 webshops, representing 36% of the market. The remaining 19% (4.739 webshops) are built using different providers. Of the most used platforms in Switzerland, only PepperShop is Swiss company.
The data from analyzing 242.061 webshops confirms that WooCommerce and Shopify hold a dominant position, commanding 73% of the market share. Breaking this dominance is no easy task, as it would not only require mass migration but also new solutions that offer greater value than the globally leading commerce platforms.
However, despite the dominance of these major providers, there are still over 80.000 webshops using other frameworks. For instance, with over 15,000 webshops on PrestaShop and more than 13,000 using Magento, there remains a significant opportunity to develop plug-ins and solutions for these platforms.
Whether you're developing plug-ins or building software reliant on specific frameworks, understanding your total addressable market (TAM) is a key indicator of potential and helps determine if an investment is worthwhile. Additionally, knowing how different markets are penetrated provides insights into where to focus future sales and marketing efforts. The more data you have, the better informed your decisions will be.
If you’re interested in more data around the webshops, don’t hesitate to contact us on hello@tembi.io. We are adding more countries continuously so sign up for our newsletter to get the latest updates.


